
 Yahoo Finance
 Tribal Group's (LON:TRB) Returns Have Hit A Wall
Finding a business that has the potential to grow substantially is not easy, but it is possible if we look at a few key financial metrics. Firstly, we'd want to identify a growing return on capital employed (ROCE) and then alongside that, an ever-increasing base of capital employed. Put simply, these types of businesses are compounding machines, meaning they are continually reinvesting their earnings at ever-higher rates of return. So, when we ran our eye over Tribal Group's (LON:TRB) trend of ROCE, we liked what we saw.
What Is Return On Capital Employed (ROCE)?
For those that aren't sure what ROCE is, it measures the amount of pre-tax profits a company can generate from the capital employed in its business. Analysts use this formula to calculate it for Tribal Group:
Return on Capital Employed = Earnings Before Interest and Tax (EBIT) ÷ (Total Assets - Current Liabilities)
0.12 = UK£7.3m ÷ (UK£102m - UK£40m) (Based on the trailing twelve months to June 2022).
So, Tribal Group has an ROCE of 12%. That's a pretty standard return and it's in line with the industry average of 12%.
View our latest analysis for Tribal Group
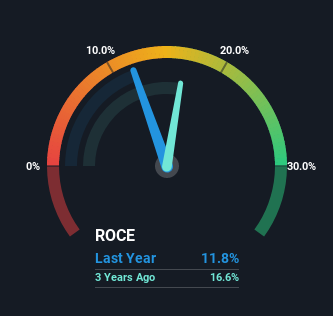
Above you can see how the current ROCE for Tribal Group compares to its prior returns on capital, but there's only so much you can tell from the past. If you'd like to see what analysts are forecasting going forward, you should check out our free report for Tribal Group.
What Can We Tell From Tribal Group's ROCE Trend?
While the current returns on capital are decent, they haven't changed much. Over the past five years, ROCE has remained relatively flat at around 12% and the business has deployed 71% more capital into its operations. 12% is a pretty standard return, and it provides some comfort knowing that Tribal Group has consistently earned this amount. Stable returns in this ballpark can be unexciting, but if they can be maintained over the long run, they often provide nice rewards to shareholders.
On a side note, Tribal Group has done well to reduce current liabilities to 39% of total assets over the last five years. This can eliminate some of the risks inherent in the operations because the business has less outstanding obligations to their suppliers and or short-term creditors than they did previously.
The Key Takeaway
To sum it up, Tribal Group has simply been reinvesting capital steadily, at those decent rates of return. However, despite the favorable fundamentals, the stock has fallen 12% over the last five years, so there might be an opportunity here for astute investors. For that reason, savvy investors might want to look further into this company in case it's a prime investment.
On a separate note, we've found 1 warning sign for Tribal Group you'll probably want to know about.
While Tribal Group may not currently earn the highest returns, we've compiled a list of companies that currently earn more than 25% return on equity. Check out this free list here.
Have feedback on this article? Concerned about the content? Get in touch with us directly. Alternatively, email editorial-team (at) simplywallst.com.
This article by Simply Wall St is general in nature. We provide commentary based on historical data and analyst forecasts only using an unbiased methodology and our articles are not intended to be financial advice. It does not constitute a recommendation to buy or sell any stock, and does not take account of your objectives, or your financial situation. We aim to bring you long-term focused analysis driven by fundamental data. Note that our analysis may not factor in the latest price-sensitive company announcements or qualitative material. Simply Wall St has no position in any stocks mentioned.
Join A Paid User Research Session
You’ll receive a US$30 Amazon Gift card for 1 hour of your time while helping us build better investing tools for the individual investors like yourself. Sign up here
