
 Yahoo Finance
 Is Tricorn Group plc (LON:TCN) Excessively Paying Its CEO?

In 2007 Mike Welburn was appointed CEO of Tricorn Group plc (LON:TCN). First, this article will compare CEO compensation with compensation at similar sized companies. Then we'll look at a snap shot of the business growth. And finally we will reflect on how common stockholders have fared in the last few years, as a secondary measure of performance. This method should give us information to assess how appropriately the company pays the CEO.
Check out our latest analysis for Tricorn Group
How Does Mike Welburn's Compensation Compare With Similar Sized Companies?
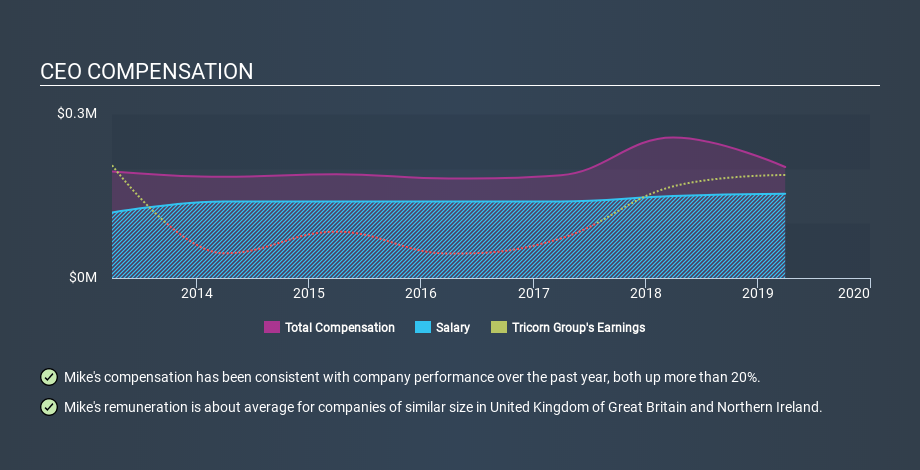
Our data indicates that Tricorn Group plc is worth UK£3.5m, and total annual CEO compensation was reported as UK£203k for the year to March 2019. We think total compensation is more important but we note that the CEO salary is lower, at UK£154k. We examined a group of similar sized companies, with market capitalizations of below UK£153m. The median CEO total compensation in that group is UK£248k.
So Mike Welburn is paid around the average of the companies we looked at. While this data point isn't particularly informative alone, it gains more meaning when considered with business performance.
The graphic below shows how CEO compensation at Tricorn Group has changed from year to year.
Is Tricorn Group plc Growing?
On average over the last three years, Tricorn Group plc has grown earnings per share (EPS) by 111% each year (using a line of best fit). Its revenue is up 2.6% over last year.
Overall this is a positive result for shareholders, showing that the company has improved in recent years. It's good to see a bit of revenue growth, as this suggests the business is able to grow sustainably. It could be important to check this free visual depiction of what analysts expect for the future.
Has Tricorn Group plc Been A Good Investment?
Given the total loss of 14% over three years, many shareholders in Tricorn Group plc are probably rather dissatisfied, to say the least. This suggests it would be unwise for the company to pay the CEO too generously.
In Summary...
Remuneration for Mike Welburn is close enough to the median pay for a CEO of a similar sized company .
We like that the company is growing EPS, but it's disappointing to see negative shareholder returns over three years. Considering the the positives we don't think the CEO pays is too high, but it's certainly hard to argue it is too low. If you think CEO compensation levels are interesting you will probably really like this free visualization of insider trading at Tricorn Group.
If you want to buy a stock that is better than Tricorn Group, this free list of high return, low debt companies is a great place to look.
If you spot an error that warrants correction, please contact the editor at editorial-team@simplywallst.com. This article by Simply Wall St is general in nature. It does not constitute a recommendation to buy or sell any stock, and does not take account of your objectives, or your financial situation. Simply Wall St has no position in the stocks mentioned.
We aim to bring you long-term focused research analysis driven by fundamental data. Note that our analysis may not factor in the latest price-sensitive company announcements or qualitative material. Thank you for reading.
