
 Yahoo Finance
 Is Tricorn Group plc's (LON:TCN) Capital Allocation Ability Worth Your Time?

Today we are going to look at Tricorn Group plc (LON:TCN) to see whether it might be an attractive investment prospect. To be precise, we'll consider its Return On Capital Employed (ROCE), as that will inform our view of the quality of the business.
First up, we'll look at what ROCE is and how we calculate it. Next, we'll compare it to others in its industry. Finally, we'll look at how its current liabilities affect its ROCE.
Return On Capital Employed (ROCE): What is it?
ROCE is a measure of a company's yearly pre-tax profit (its return), relative to the capital employed in the business. All else being equal, a better business will have a higher ROCE. Ultimately, it is a useful but imperfect metric. Renowned investment researcher Michael Mauboussin has suggested that a high ROCE can indicate that 'one dollar invested in the company generates value of more than one dollar'.
How Do You Calculate Return On Capital Employed?
The formula for calculating the return on capital employed is:
Return on Capital Employed = Earnings Before Interest and Tax (EBIT) ÷ (Total Assets - Current Liabilities)
Or for Tricorn Group:
0.12 = UK£877k ÷ (UK£15m - UK£7.6m) (Based on the trailing twelve months to March 2019.)
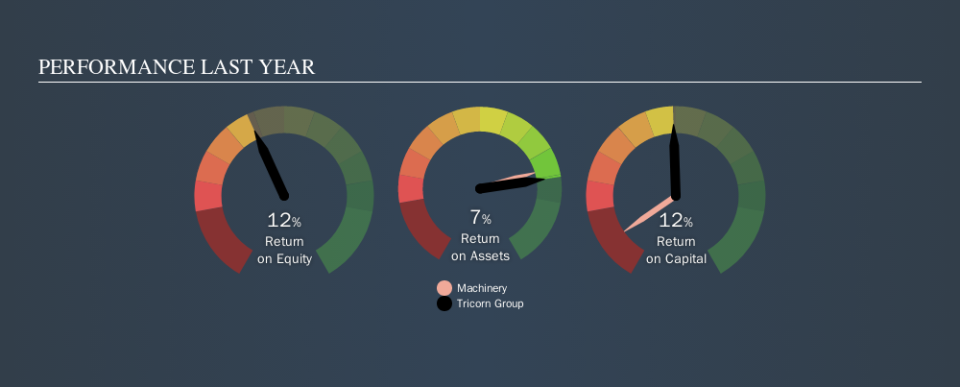
Therefore, Tricorn Group has an ROCE of 12%.
View our latest analysis for Tricorn Group
Is Tricorn Group's ROCE Good?
ROCE can be useful when making comparisons, such as between similar companies. We can see Tricorn Group's ROCE is around the 13% average reported by the Machinery industry. Independently of how Tricorn Group compares to its industry, its ROCE in absolute terms appears decent, and the company may be worthy of closer investigation.
Tricorn Group reported an ROCE of 12% -- better than 3 years ago, when the company didn't make a profit. That implies the business has been improving. You can see in the image below how Tricorn Group's ROCE compares to its industry. Click to see more on past growth.
When considering ROCE, bear in mind that it reflects the past and does not necessarily predict the future. ROCE can be deceptive for cyclical businesses, as returns can look incredible in boom times, and terribly low in downturns. ROCE is only a point-in-time measure. What happens in the future is pretty important for investors, so we have prepared a free report on analyst forecasts for Tricorn Group.
How Tricorn Group's Current Liabilities Impact Its ROCE
Liabilities, such as supplier bills and bank overdrafts, are referred to as current liabilities if they need to be paid within 12 months. The ROCE equation subtracts current liabilities from capital employed, so a company with a lot of current liabilities appears to have less capital employed, and a higher ROCE than otherwise. To counteract this, we check if a company has high current liabilities, relative to its total assets.
Tricorn Group has total liabilities of UK£7.6m and total assets of UK£15m. Therefore its current liabilities are equivalent to approximately 51% of its total assets. Tricorn Group's current liabilities are fairly high, which increases its ROCE significantly.
The Bottom Line On Tricorn Group's ROCE
While its ROCE looks decent, it wouldn't look so good if it reduced current liabilities. There might be better investments than Tricorn Group out there, but you will have to work hard to find them . These promising businesses with rapidly growing earnings might be right up your alley.
If you like to buy stocks alongside management, then you might just love this free list of companies. (Hint: insiders have been buying them).
We aim to bring you long-term focused research analysis driven by fundamental data. Note that our analysis may not factor in the latest price-sensitive company announcements or qualitative material.
If you spot an error that warrants correction, please contact the editor at editorial-team@simplywallst.com. This article by Simply Wall St is general in nature. It does not constitute a recommendation to buy or sell any stock, and does not take account of your objectives, or your financial situation. Simply Wall St has no position in the stocks mentioned. Thank you for reading.
