
 Yahoo Finance
 TriMas (TRS) Q1 Earnings & Revenues Top Estimates, Rise Y/Y
TriMas Corporation TRS reported first-quarter 2024 adjusted earnings per share (EPS) of 37 cents, surpassing the Zacks Consensus Estimate of 28 cents. Compared with adjusted earnings of 35 cents (including non-cash compensation expense) in the year-ago quarter, the bottom-line figure indicates a 5.7% increase. This reflects improved results in the Aerospace and Packaging segments, gains from recent acquisitions, and operational improvements, which offset the impacts of higher interest and tax expenses.
Including the impacts of one-time items, the company reported an EPS of 12 cents, which was flat with the year-ago quarter.
Revenues increased 5.4% year over year to $227 million. The top line beat the Zacks Consensus Estimate of $217 million. The increase was attributed to organic growth in aerospace and defense, some packaging product lines, and contributions from acquisitions. However, weak market demand for products used in certain industrial, and oil and gas applications negated some of these tailwinds.
TriMas Corporation Price, Consensus and EPS Surprise
TriMas Corporation price-consensus-eps-surprise-chart | TriMas Corporation Quote
Costs & Margins
The cost of sales increased 3.9% year over year to $174 million. Gross profit increased 10.5% year over year to around $53 million. The gross margin was 23.2% compared with 22.1% in the prior-year quarter.
Selling, general and administrative expenses moved up 6.8% year over year to $40 million. Adjusted operating profit increased 4.7% year over year to $16.3 million. An increase in sales volumes, gains from recent acquisitions and operational improvements helped offset the impact of lower absorption within Specialty Products and higher non-cash stock compensation, resulting in an improvement in the operating profit. The adjusted operating margin was 7.2%, flat compared with the prior-year quarter.
Segmental Performance
Packaging: Net sales were $127 million, up 9.3% from the year-ago quarter’s $116 million. Organic growth in the personal care, beauty and industrial end markets, and acquisition-related sales offset weak demand in some beverage-related applications. We had predicted net sales at $117.5 million.
Adjusted operating profit increased 18.2% year over year to $18 million driven by higher sales and prior structural cost reductions that offset the impact of the allocation of certain information technology costs to the segment. The figure was higher than our estimate of $11.6 million.
Aerospace: Net sales increased 34.7% year over year to $67 million attributed to demand stemming from higher aerospace production, easing of production constraints and acquisition-related sales. The figure surpassed our estimate of $55.5 million.
The segment reported an adjusted operating profit of $7 million, marking a substantial jump from the year-ago quarter’s $1.4 million, driven by the company’s operational excellence initiatives and higher conversion rates. We had projected the segment’s adjusted operating profit at $3.9 million.
Specialty Products: The segment's revenues decreased 33.5% year over year to $32.7 million as industrial customers continued to rebalance inventories. We predicted net sales to be $44.2 million.
Adjusted operating profit slumped 73% year over year to $2.6 million owing to decreased sales and the related lower absorption of costs. The figure missed our estimate of $4.9 million.
Financial Performance
TriMas repurchased approximately 540,037 shares of its outstanding common stock for $13.3 million. As of the quarter’s end, $73.6 million remained authorized for further repurchases.
As of Mar 31, 2024, the company had $30.5 million of cash on hand and $257.4 million of available borrowing capacity under its revolving credit facility. TriMas used $3.7 million of cash in operating activities against $9.7 million of cash flow generated in the prior-year quarter.
TriMas ended the first quarter with a total debt of $424.9 million compared with $395.7 million at the fiscal 2023 end. Net debt was $394.5 million as of Mar 31, 2024, higher than $360.8 million as of Dec 31,2023.
2024 Guidance
TriMas expects adjusted EPS to be in the range of $1.95 to $2.15 in 2024. It foresees continued strong demand in the aerospace and defense markets throughout the year. Improved performances in both TriMas Packaging and TriMas Aerospace segments are anticipated to offset any potential decrease in demand within the Specialty Products segment.
Price Performance
TRS shares have gained 2.1% in the past year compared with the industry’s 30.7% growth.
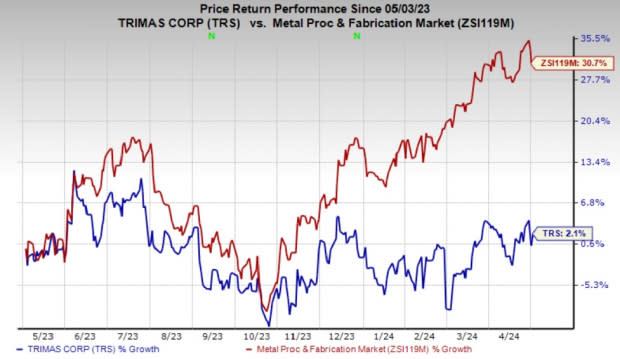
Image Source: Zacks Investment Research
Zacks Rank
TriMas carries a Zacks Rank #4 (Sell) at present.
You can see the complete list of today's Zacks #1 Rank (Strong Buy) stocks here.
How Did TRS’ Industry Peers Fare in Q1?
The Timken Company TKR reported adjusted EPS of $1.77 in first-quarter 2024, beating the Zacks Consensus Estimate of $1.50. The bottom line declined 15% year over year from the record EPS of $2.09 in the year-ago quarter as low volumes offset the impact of favorable price realization.
Timken’s revenues in the quarter were $1.19 billion, down 5.7% from the record figure of $1.26 billion in the year-ago quarter. The decline was attributed to low demand, particularly in renewable energy in China, and unfavorable foreign currency translation, partially offset by the benefit of acquisitions and favorable pricing. The top line beat the consensus estimate of $1.16 billion.
Kaiser Aluminum KALU reported first-quarter adjusted EPS of $1.02, which beat the Zacks Consensus Estimate of 58 cents by a solid margin of 76%. The bottom-line figure increased 3% from the year-ago quarter.
Net sales declined 9% year over year to $738 million but beat the consensus estimate of $687 million. Net sales for Kaiser Aluminum’s aerospace/high-strength applications were up 12% on higher pricing and shipments. This was offset by an 11% decline in sales for packaging applications due to lower shipments for coated food products.
ESAB Corporation ESAB reported adjusted EPS of $1.20 in first-quarter 2024, surpassing the Zacks Consensus Estimate of $1.11. The bottom line rose 15% year over year reflecting the gains from its ESAB Business Excellence, its unique business-management system to drive growth and margin expansion.
ESAB reported record first-quarter sales of $690 million, which beat the consensus estimate of $667 million. Sales were up 1% year over year on a reported basis.
Want the latest recommendations from Zacks Investment Research? Today, you can download 7 Best Stocks for the Next 30 Days. Click to get this free report
Timken Company (The) (TKR) : Free Stock Analysis Report
Kaiser Aluminum Corporation (KALU) : Free Stock Analysis Report
TriMas Corporation (TRS) : Free Stock Analysis Report
ESAB Corporation (ESAB) : Free Stock Analysis Report
