
 Yahoo Finance
 Triple Point Social Housing REIT (LON:SOHO) Shareholders Have Enjoyed A 13% Share Price Gain
We believe investing is smart because history shows that stock markets go higher in the long term. But if when you choose to buy stocks, some of them will be below average performers. Unfortunately for shareholders, while the Triple Point Social Housing REIT plc (LON:SOHO) share price is up 13% in the last year, that falls short of the market return. However, the stock hasn't done so well in the longer term, with the stock only up 3.2% in three years.
See our latest analysis for Triple Point Social Housing REIT
In his essay The Superinvestors of Graham-and-Doddsville Warren Buffett described how share prices do not always rationally reflect the value of a business. By comparing earnings per share (EPS) and share price changes over time, we can get a feel for how investor attitudes to a company have morphed over time.
During the last year Triple Point Social Housing REIT grew its earnings per share (EPS) by 0.9%. The share price gain of 13% certainly outpaced the EPS growth. This indicates that the market is now more optimistic about the stock.
The company's earnings per share (over time) is depicted in the image below (click to see the exact numbers).
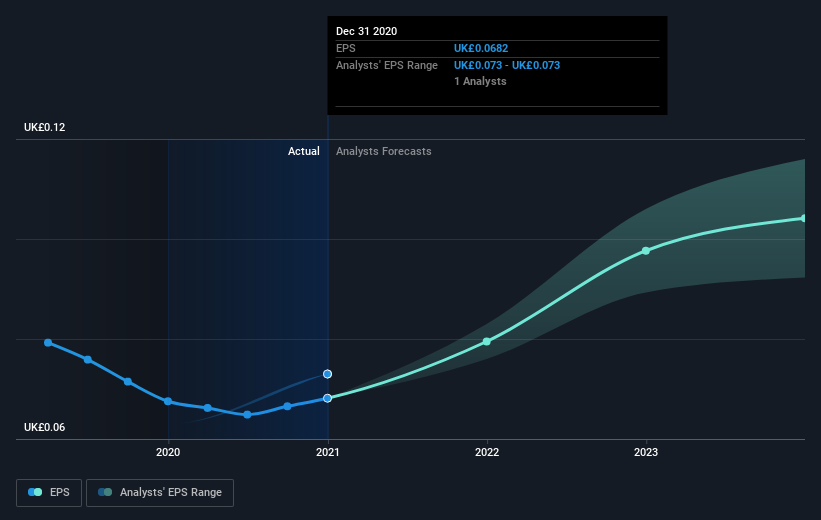
This free interactive report on Triple Point Social Housing REIT's earnings, revenue and cash flow is a great place to start, if you want to investigate the stock further.
What About Dividends?
As well as measuring the share price return, investors should also consider the total shareholder return (TSR). Whereas the share price return only reflects the change in the share price, the TSR includes the value of dividends (assuming they were reinvested) and the benefit of any discounted capital raising or spin-off. Arguably, the TSR gives a more comprehensive picture of the return generated by a stock. As it happens, Triple Point Social Housing REIT's TSR for the last year was 18%, which exceeds the share price return mentioned earlier. The dividends paid by the company have thusly boosted the total shareholder return.
A Different Perspective
Triple Point Social Housing REIT shareholders are up 18% for the year (even including dividends). While you don't go broke making a profit, this return was actually lower than the average market return of about 30%. On the other hand, the TSR over three years was worse, at just 6% per year. This suggests the company's position is improving. If the share price is up as a result of improved business performance, then this kind of improvement may be sustained. It's always interesting to track share price performance over the longer term. But to understand Triple Point Social Housing REIT better, we need to consider many other factors. Consider for instance, the ever-present spectre of investment risk. We've identified 4 warning signs with Triple Point Social Housing REIT (at least 1 which is potentially serious) , and understanding them should be part of your investment process.
If you are like me, then you will not want to miss this free list of growing companies that insiders are buying.
Please note, the market returns quoted in this article reflect the market weighted average returns of stocks that currently trade on GB exchanges.
This article by Simply Wall St is general in nature. It does not constitute a recommendation to buy or sell any stock, and does not take account of your objectives, or your financial situation. We aim to bring you long-term focused analysis driven by fundamental data. Note that our analysis may not factor in the latest price-sensitive company announcements or qualitative material. Simply Wall St has no position in any stocks mentioned.
Have feedback on this article? Concerned about the content? Get in touch with us directly. Alternatively, email editorial-team (at) simplywallst.com.
