
 Yahoo Finance
 Update: Tritax Big Box REIT Stock Gained 37% In The Last Five Years

When we invest, we’re generally looking for stocks that outperform the market average. And while active stock picking involves risks (and requires diversification) it can also provide excess returns. For example, long term Tritax Big Box REIT plc (LON:BBOX) shareholders have enjoyed a 37% share price rise over the last half decade, well in excess of the market return of around 2.2% (not including dividends). However, more recent returns haven’t been as impressive as that, with the stock returning just 5.1% in the last year, including dividends.
Check out our latest analysis for Tritax Big Box REIT
While markets are a powerful pricing mechanism, share prices reflect investor sentiment, not just underlying business performance. One flawed but reasonable way to assess how sentiment around a company has changed is to compare the earnings per share (EPS) with the share price.
Over half a decade, Tritax Big Box REIT managed to grow its earnings per share at 8.9% a year. The EPS growth is more impressive than the yearly share price gain of 6.5% over the same period. So it seems the market isn’t so enthusiastic about the stock these days. This cautious sentiment is reflected in its (fairly low) P/E ratio of 7.21.
You can see how EPS has changed over time in the image below (click on the chart to see the exact values).
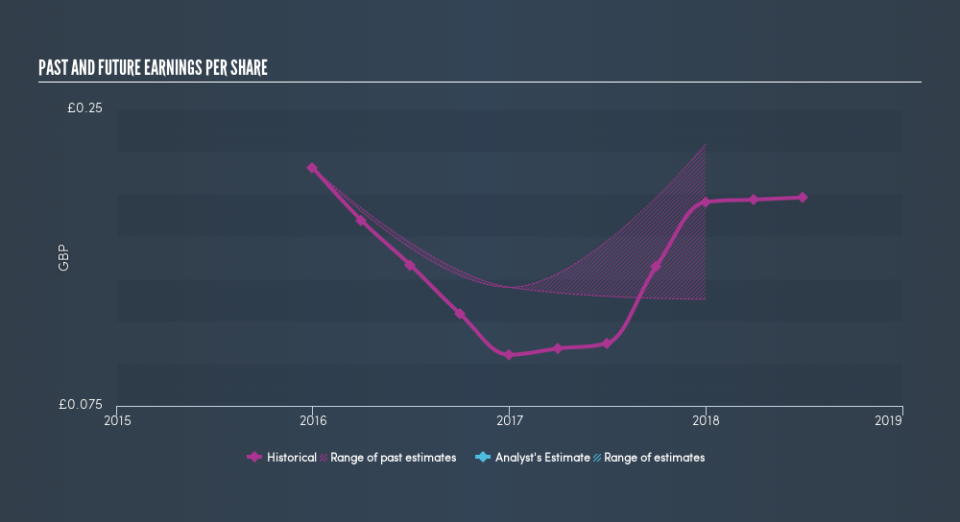
It’s probably worth noting we’ve seen significant insider buying in the last quarter, which we consider a positive. On the other hand, we think the revenue and earnings trends are much more meaningful measures of the business. Dive deeper into the earnings by checking this interactive graph of Tritax Big Box REIT’s earnings, revenue and cash flow.
What About Dividends?
When looking at investment returns, it is important to consider the difference between total shareholder return (TSR) and share price return. The TSR incorporates the value of any discounted capital raisings, along with any dividends, based on the assumption that the dividends are reinvested. It’s fair to say that the TSR gives a more complete picture for stocks that pay a dividend. We note that for Tritax Big Box REIT the TSR over the last 5 years was 69%, which is better than the share price return mentioned above. This is largely a result of its dividend payments!
A Different Perspective
It’s nice to see that Tritax Big Box REIT shareholders have received a total shareholder return of 5.1% over the last year. Of course, that includes the dividend. However, the TSR over five years, coming in at 11% per year, is even more impressive. Potential buyers might understandably feel they’ve missed the opportunity, but it’s always possible business is still firing on all cylinders. If you want to research this stock further, the data on insider buying is an obvious place to start. You can click here to see who has been buying shares – and the price they paid.
Tritax Big Box REIT is not the only stock that insiders are buying. For those who like to find winning investments this free list of growing companies with recent insider purchasing, could be just the ticket.
Please note, the market returns quoted in this article reflect the market weighted average returns of stocks that currently trade on GB exchanges.
We aim to bring you long-term focused research analysis driven by fundamental data. Note that our analysis may not factor in the latest price-sensitive company announcements or qualitative material.
If you spot an error that warrants correction, please contact the editor at editorial-team@simplywallst.com. This article by Simply Wall St is general in nature. It does not constitute a recommendation to buy or sell any stock, and does not take account of your objectives, or your financial situation. Simply Wall St has no position in the stocks mentioned. Thank you for reading.
