
 Yahoo Finance
 Trustpilot Group plc's (LON:TRST) Share Price Matching Investor Opinion
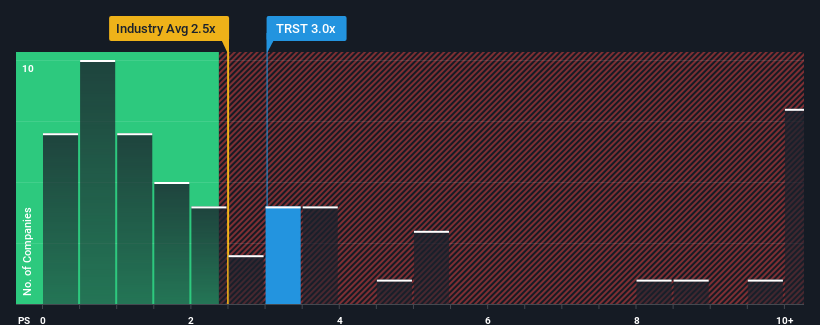
When close to half the companies in the Interactive Media and Services industry in the United Kingdom have price-to-sales ratios (or "P/S") below 2.2x, you may consider Trustpilot Group plc (LON:TRST) as a stock to potentially avoid with its 3x P/S ratio. Although, it's not wise to just take the P/S at face value as there may be an explanation why it's as high as it is.
View our latest analysis for Trustpilot Group
How Trustpilot Group Has Been Performing
With revenue growth that's inferior to most other companies of late, Trustpilot Group has been relatively sluggish. Perhaps the market is expecting future revenue performance to undergo a reversal of fortunes, which has elevated the P/S ratio. You'd really hope so, otherwise you're paying a pretty hefty price for no particular reason.
Want the full picture on analyst estimates for the company? Then our free report on Trustpilot Group will help you uncover what's on the horizon.
What Are Revenue Growth Metrics Telling Us About The High P/S?
There's an inherent assumption that a company should outperform the industry for P/S ratios like Trustpilot Group's to be considered reasonable.
Taking a look back first, we see that the company managed to grow revenues by a handy 13% last year. The latest three year period has also seen an excellent 82% overall rise in revenue, aided somewhat by its short-term performance. Therefore, it's fair to say the revenue growth recently has been superb for the company.
Looking ahead now, revenue is anticipated to climb by 17% per annum during the coming three years according to the eight analysts following the company. With the industry only predicted to deliver 9.1% each year, the company is positioned for a stronger revenue result.
In light of this, it's understandable that Trustpilot Group's P/S sits above the majority of other companies. Apparently shareholders aren't keen to offload something that is potentially eyeing a more prosperous future.
What Does Trustpilot Group's P/S Mean For Investors?
Using the price-to-sales ratio alone to determine if you should sell your stock isn't sensible, however it can be a practical guide to the company's future prospects.
We've established that Trustpilot Group maintains its high P/S on the strength of its forecasted revenue growth being higher than the the rest of the Interactive Media and Services industry, as expected. It appears that shareholders are confident in the company's future revenues, which is propping up the P/S. Unless these conditions change, they will continue to provide strong support to the share price.
There are also other vital risk factors to consider before investing and we've discovered 1 warning sign for Trustpilot Group that you should be aware of.
If strong companies turning a profit tickle your fancy, then you'll want to check out this free list of interesting companies that trade on a low P/E (but have proven they can grow earnings).
Have feedback on this article? Concerned about the content? Get in touch with us directly. Alternatively, email editorial-team (at) simplywallst.com.
This article by Simply Wall St is general in nature. We provide commentary based on historical data and analyst forecasts only using an unbiased methodology and our articles are not intended to be financial advice. It does not constitute a recommendation to buy or sell any stock, and does not take account of your objectives, or your financial situation. We aim to bring you long-term focused analysis driven by fundamental data. Note that our analysis may not factor in the latest price-sensitive company announcements or qualitative material. Simply Wall St has no position in any stocks mentioned.
Join A Paid User Research Session
You’ll receive a US$30 Amazon Gift card for 1 hour of your time while helping us build better investing tools for the individual investors like yourself. Sign up here
