
 Yahoo Finance
 Is TT Electronics plc’s (LON:TTG) Balance Sheet A Threat To Its Future?

TT Electronics plc (LON:TTG) is a small-cap stock with a market capitalization of UK£299m. While investors primarily focus on the growth potential and competitive landscape of the small-cap companies, they end up ignoring a key aspect, which could be the biggest threat to its existence: its financial health. Why is it important? Electronic companies, even ones that are profitable, are more likely to be higher risk. Evaluating financial health as part of your investment thesis is vital. Here are a few basic checks that are good enough to have a broad overview of the company’s financial strength. Nevertheless, I know these factors are very high-level, so I recommend you dig deeper yourself into TTG here.
Does TTG produce enough cash relative to debt?
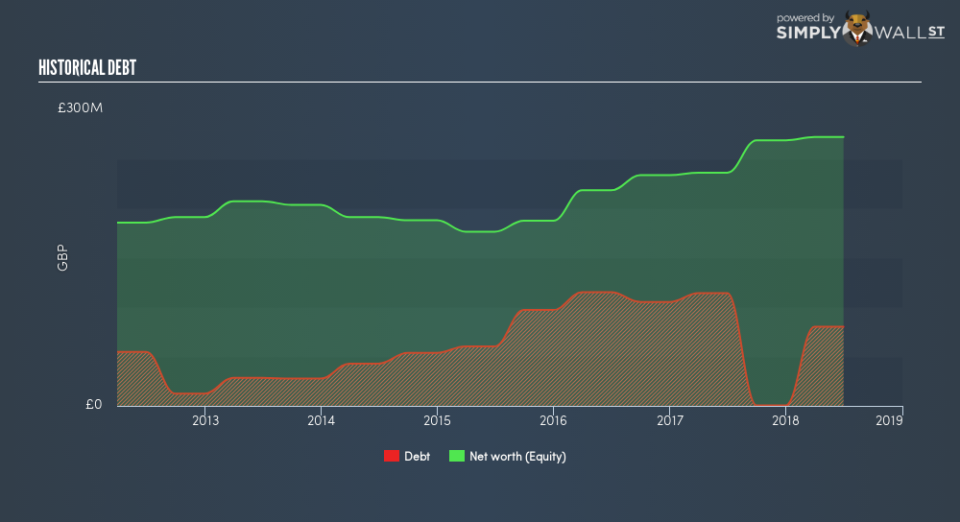
Over the past year, TTG has reduced its debt from UK£114m to UK£80m , which also accounts for long term debt. With this debt repayment, TTG currently has UK£39m remaining in cash and short-term investments , ready to deploy into the business. On top of this, TTG has produced UK£21m in operating cash flow during the same period of time, resulting in an operating cash to total debt ratio of 26%, signalling that TTG’s debt is appropriately covered by operating cash. This ratio can also be interpreted as a measure of efficiency as an alternative to return on assets. In TTG’s case, it is able to generate 0.26x cash from its debt capital.
Does TTG’s liquid assets cover its short-term commitments?
At the current liabilities level of UK£112m, the company has maintained a safe level of current assets to meet its obligations, with the current ratio last standing at 1.83x. Usually, for Electronic companies, this is a suitable ratio since there’s a sufficient cash cushion without leaving too much capital idle or in low-earning investments.
Is TTG’s debt level acceptable?
TTG’s level of debt is appropriate relative to its total equity, at 29%. TTG is not taking on too much debt commitment, which may be constraining for future growth. We can test if TTG’s debt levels are sustainable by measuring interest payments against earnings of a company. Ideally, earnings before interest and tax (EBIT) should cover net interest by at least three times. For TTG, the ratio of 14.86x suggests that interest is comfortably covered, which means that debtors may be willing to loan the company more money, giving TTG ample headroom to grow its debt facilities.
Next Steps:
TTG’s debt level is appropriate for a company its size, and it is also able to generate sufficient cash flow coverage, meaning it has been able to put its debt in good use. Furthermore, the company exhibits proper management of current assets and upcoming liabilities. I admit this is a fairly basic analysis for TTG’s financial health. Other important fundamentals need to be considered alongside. I suggest you continue to research TT Electronics to get a more holistic view of the stock by looking at:
Future Outlook: What are well-informed industry analysts predicting for TTG’s future growth? Take a look at our free research report of analyst consensus for TTG’s outlook.
Valuation: What is TTG worth today? Is the stock undervalued, even when its growth outlook is factored into its intrinsic value? The intrinsic value infographic in our free research report helps visualize whether TTG is currently mispriced by the market.
Other High-Performing Stocks: Are there other stocks that provide better prospects with proven track records? Explore our free list of these great stocks here.
To help readers see past the short term volatility of the financial market, we aim to bring you a long-term focused research analysis purely driven by fundamental data. Note that our analysis does not factor in the latest price-sensitive company announcements.
The author is an independent contributor and at the time of publication had no position in the stocks mentioned. For errors that warrant correction please contact the editor at editorial-team@simplywallst.com.
