
 Yahoo Finance
 Tuesday Morning Corporation (NASDAQ:TUES): Does The Earnings Decline Make It An Underperformer?

Today I will examine Tuesday Morning Corporation’s (NASDAQ:TUES) latest earnings update (31 March 2018) and compare these figures against its performance over the past couple of years, in addition to how the rest of TUES’s industry performed. As a long-term investor, I find it useful to analyze the company’s trend over time in order to estimate whether or not the company is able to meet its goals, and eventually grow sustainably over time. See our latest analysis for Tuesday Morning
Commentary On TUES’s Past Performance
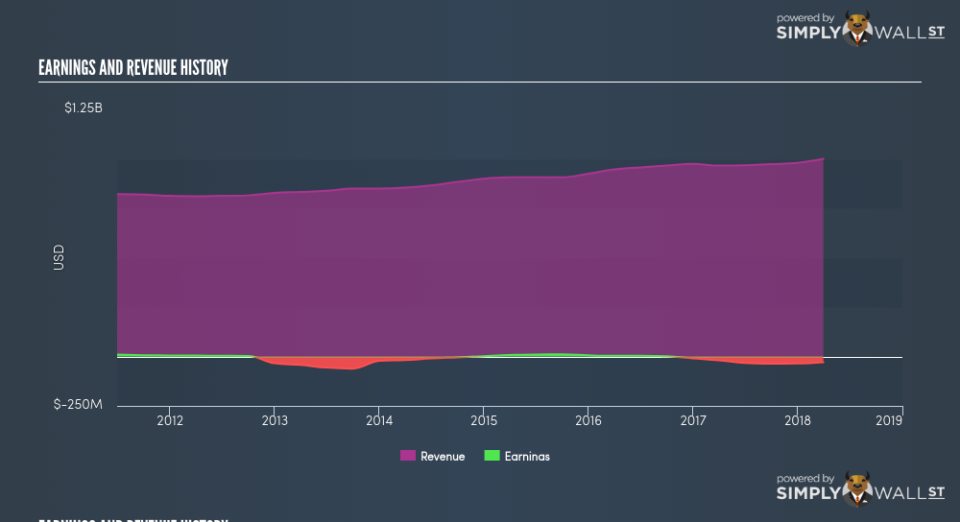
TUES is loss-making, with the most recent trailing twelve-month earnings of -US$28.96m (from 31 March 2018), which compared to last year has become more negative. Furthermore, the company’s loss seem to be growing over time, with the five-year earnings average of -US$12.04m. Each year, for the past five years TUES has seen an annual increase in operating expense growth, outpacing revenue growth of 3.41%, on average. This adverse movement is a driver of the company’s inability to reach breakeven. Inspecting growth from a sector-level, the US multiline retail industry has been growing its average earnings by double-digit 16.58% in the past twelve months, and a less exciting 6.34% over the previous five years. This suggests that whatever uplift the industry is profiting from, Tuesday Morning has not been able to realize the gains unlike its average peer.
Given that Tuesday Morning is currently unprofitable, with operating expenses (opex) growing year-on-year at 4.39%, it may need to raise more cash over the next year. It currently has US$12.28m in cash and short-term investments, however, opex (SG&A and one-year R&D) reached US$362.84m in the latest twelve months. Although this is a relatively simplistic calculation, and Tuesday Morning may reduce its costs or raise debt capital instead of coming to equity markets, the analysis still helps us understand how sustainable the Tuesday Morning’s operation is, and when things may have to change.
What does this mean?
Though Tuesday Morning’s past data is helpful, it is only one aspect of my investment thesis. With companies that are currently loss-making, it is always difficult to forecast what will happen in the future and when. The most valuable step is to examine company-specific issues Tuesday Morning may be facing and whether management guidance has dependably been met in the past. I recommend you continue to research Tuesday Morning to get a more holistic view of the stock by looking at:
Future Outlook: What are well-informed industry analysts predicting for TUES’s future growth? Take a look at our free research report of analyst consensus for TUES’s outlook.
Financial Health: Is TUES’s operations financially sustainable? Balance sheets can be hard to analyze, which is why we’ve done it for you. Check out our financial health checks here.
Other High-Performing Stocks: Are there other stocks that provide better prospects with proven track records? Explore our free list of these great stocks here.
NB: Figures in this article are calculated using data from the trailing twelve months from 31 March 2018. This may not be consistent with full year annual report figures.
To help readers see pass the short term volatility of the financial market, we aim to bring you a long-term focused research analysis purely driven by fundamental data. Note that our analysis does not factor in the latest price sensitive company announcements.
The author is an independent contributor and at the time of publication had no position in the stocks mentioned.
