
 Yahoo Finance
 What Is Turning Point Brands's (NYSE:TPB) P/E Ratio After Its Share Price Rocketed?

Turning Point Brands (NYSE:TPB) shareholders are no doubt pleased to see that the share price has bounced 30% in the last month alone, although it is still down 23% over the last quarter. The bad news is that even after that recovery shareholders are still underwater by about 6.5% for the full year.
All else being equal, a sharp share price increase should make a stock less attractive to potential investors. While the market sentiment towards a stock is very changeable, in the long run, the share price will tend to move in the same direction as earnings per share. The implication here is that deep value investors might steer clear when expectations of a company are too high. Perhaps the simplest way to get a read on investors' expectations of a business is to look at its Price to Earnings Ratio (PE Ratio). A high P/E implies that investors have high expectations of what a company can achieve compared to a company with a low P/E ratio.
View our latest analysis for Turning Point Brands
How Does Turning Point Brands's P/E Ratio Compare To Its Peers?
We can tell from its P/E ratio of 17.35 that there is some investor optimism about Turning Point Brands. You can see in the image below that the average P/E (15.0) for companies in the tobacco industry is lower than Turning Point Brands's P/E.
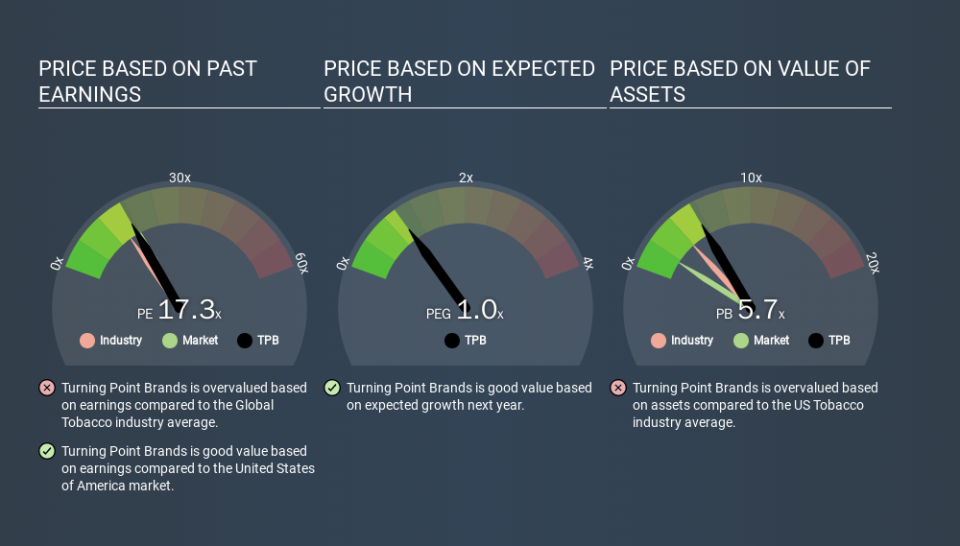
That means that the market expects Turning Point Brands will outperform other companies in its industry. Clearly the market expects growth, but it isn't guaranteed. So investors should always consider the P/E ratio alongside other factors, such as whether company directors have been buying shares.
How Growth Rates Impact P/E Ratios
P/E ratios primarily reflect market expectations around earnings growth rates. That's because companies that grow earnings per share quickly will rapidly increase the 'E' in the equation. That means even if the current P/E is high, it will reduce over time if the share price stays flat. Then, a lower P/E should attract more buyers, pushing the share price up.
Turning Point Brands increased earnings per share by a whopping 28% last year. And it has improved its earnings per share by 20% per year over the last three years. So we'd generally expect it to have a relatively high P/E ratio.
A Limitation: P/E Ratios Ignore Debt and Cash In The Bank
It's important to note that the P/E ratio considers the market capitalization, not the enterprise value. That means it doesn't take debt or cash into account. In theory, a company can lower its future P/E ratio by using cash or debt to invest in growth.
Spending on growth might be good or bad a few years later, but the point is that the P/E ratio does not account for the option (or lack thereof).
Turning Point Brands's Balance Sheet
Turning Point Brands's net debt equates to 44% of its market capitalization. You'd want to be aware of this fact, but it doesn't bother us.
The Bottom Line On Turning Point Brands's P/E Ratio
Turning Point Brands has a P/E of 17.3. That's around the same as the average in the US market, which is 18.3. With only modest debt levels, and strong earnings growth, the market seems to doubt that the growth can be maintained. Because analysts are predicting more growth in the future, one might have expected to see a higher P/E ratio. You can take a closer look at the fundamentals, here. What we know for sure is that investors have become more excited about Turning Point Brands recently, since they have pushed its P/E ratio from 13.3 to 17.3 over the last month. For those who prefer to invest with the flow of momentum, that might mean it's time to put the stock on a watchlist, or research it. But the contrarian may see it as a missed opportunity.
When the market is wrong about a stock, it gives savvy investors an opportunity. If the reality for a company is not as bad as the P/E ratio indicates, then the share price should increase as the market realizes this. So this free visual report on analyst forecasts could hold the key to an excellent investment decision.
Of course you might be able to find a better stock than Turning Point Brands. So you may wish to see this free collection of other companies that have grown earnings strongly.
If you spot an error that warrants correction, please contact the editor at editorial-team@simplywallst.com. This article by Simply Wall St is general in nature. It does not constitute a recommendation to buy or sell any stock, and does not take account of your objectives, or your financial situation. Simply Wall St has no position in the stocks mentioned.
We aim to bring you long-term focused research analysis driven by fundamental data. Note that our analysis may not factor in the latest price-sensitive company announcements or qualitative material. Thank you for reading.
