
 Yahoo Finance
 What Type Of Returns Would EnQuest's(LON:ENQ) Shareholders Have Earned If They Purchased Their SharesFive Years Ago?

We think intelligent long term investing is the way to go. But unfortunately, some companies simply don't succeed. For example the EnQuest PLC (LON:ENQ) share price dropped 63% over five years. That is extremely sub-optimal, to say the least. And we doubt long term believers are the only worried holders, since the stock price has declined 33% over the last twelve months. Unfortunately the share price momentum is still quite negative, with prices down 12% in thirty days.
See our latest analysis for EnQuest
In his essay The Superinvestors of Graham-and-Doddsville Warren Buffett described how share prices do not always rationally reflect the value of a business. One flawed but reasonable way to assess how sentiment around a company has changed is to compare the earnings per share (EPS) with the share price.
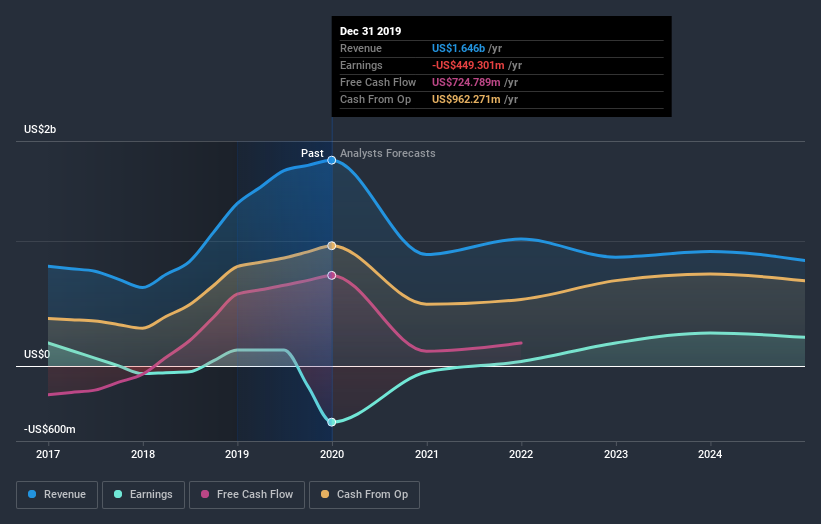
EnQuest has made a profit in the past. On the other hand, it reported a trailing twelve months loss, suggesting it isn't reliably profitable. Other metrics may better explain the share price move.
In contrast to the share price, revenue has actually increased by 12% a year in the five year period. So it seems one might have to take closer look at the fundamentals to understand why the share price languishes. After all, there may be an opportunity.
The graphic below depicts how earnings and revenue have changed over time (unveil the exact values by clicking on the image).
We consider it positive that insiders have made significant purchases in the last year. Even so, future earnings will be far more important to whether current shareholders make money. If you are thinking of buying or selling EnQuest stock, you should check out this free report showing analyst profit forecasts.
What about the Total Shareholder Return (TSR)?
We'd be remiss not to mention the difference between EnQuest's total shareholder return (TSR) and its share price return. The TSR attempts to capture the value of dividends (as if they were reinvested) as well as any spin-offs or discounted capital raisings offered to shareholders. EnQuest hasn't been paying dividends, but its TSR of -57% exceeds its share price return of -63%, implying it has either spun-off a business, or raised capital at a discount; thereby providing additional value to shareholders.
A Different Perspective
While the broader market lost about 8.2% in the twelve months, EnQuest shareholders did even worse, losing 33%. Having said that, it's inevitable that some stocks will be oversold in a falling market. The key is to keep your eyes on the fundamental developments. Regrettably, last year's performance caps off a bad run, with the shareholders facing a total loss of 9.5% per year over five years. Generally speaking long term share price weakness can be a bad sign, though contrarian investors might want to research the stock in hope of a turnaround. While it is well worth considering the different impacts that market conditions can have on the share price, there are other factors that are even more important. For example, we've discovered 1 warning sign for EnQuest that you should be aware of before investing here.
If you like to buy stocks alongside management, then you might just love this free list of companies. (Hint: insiders have been buying them).
Please note, the market returns quoted in this article reflect the market weighted average returns of stocks that currently trade on GB exchanges.
This article by Simply Wall St is general in nature. It does not constitute a recommendation to buy or sell any stock, and does not take account of your objectives, or your financial situation. We aim to bring you long-term focused analysis driven by fundamental data. Note that our analysis may not factor in the latest price-sensitive company announcements or qualitative material. Simply Wall St has no position in any stocks mentioned.
Have feedback on this article? Concerned about the content? Get in touch with us directly. Alternatively, email editorial-team@simplywallst.com.
