
 Yahoo Finance
 U.S. Dollar Index (DX) Futures Technical Analysis – Trader Reaction to 103.530 Will Set the Tone on Monday
The U.S. Dollar inched higher against a basket of currencies on Friday as central banks and governments pledged masses of cash to reduce the economic impact of the coronavirus pandemic. As the spread of the coronavirus brought much of the world to a halt, nations have poured ever-more massive amounts of stimulus into their economies while central banks have flooded markets with cheap dollars to ease funding strains.
On Friday, June U.S. Dollar Index futures settled at 103.502, down 0.103 or -0.10%.
Despite the strong surge in the U.S. Dollar, bullish traders should not get too complacent because the rally could end in a thud if central banks decide the dollar’s strength is too excessive and damaging to their economies. According to Reuters, “From Brazil to Norway, policymakers are leaping to defend currencies against the onslaught of the dollar which scaled three-year peaks on Friday, raising speculation that a joint move by the world’s biggest central banks may be in the offing.”
Daily Technical Analysis
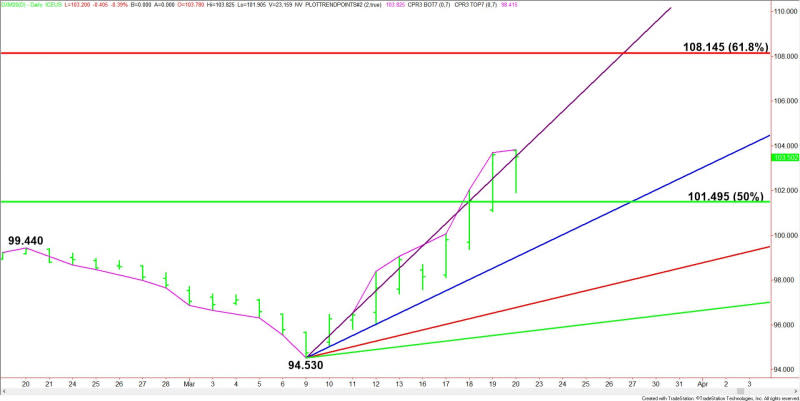
The main trend is up according to the daily swing chart. Higher-highs will keep the uptrend intact, while a move through the last main bottom at 94.530 will change the main trend to down.
We’re not expecting a change in trend, but we are watching for a topping signal. The market is currently up nine sessions from its last main bottom, which puts it inside the window of time for a potentially bearish closing price reversal top. This won’t change the main trend to down, but it could trigger a 2 to 3 day break, or a 50% to 61.8% correction of the last rally.
The index also settled inside a major retracement zone at 101.495 to 108.145. This zone is controlling the longer-term direction of the index.
Short-Term Outlook
The key Gann angle to watch is moving up at a rate of 1.000 per day from the March 9 main bottom at 94.530. It came in at 103.530 on Friday. The index has been hugging this angle for 9 sessions.
Crossing to the strong side of the Gann angle will put the June U.S. Dollar Index in a bullish position. If it continues to follow this angle higher then look for the rally to possibly extend into the Fibonacci level at 108.145 on March 26 to March 27.
A sustained move under the Gann angle will indicate the buying is getting weaker or the selling a little stronger. This could lead to a test of the major 50% level at 101.495.
A trade through 101.495 will indicate the selling is getting stronger. This could lead to a further break into the next uptrending Gann angle at 99.030.
This article was originally posted on FX Empire
