
 Yahoo Finance
UK housing market: what’s really happening with house prices
It can be difficult to know where to start when it comes to house prices.
Depending on which index you go by you could be full of confidence about the direction prices are heading in or filled with a sense of panic.
But before you make any rash decisions based on one figure, how about getting a clearer picture of house price activity by comparing all of them?
The chances are you have more important things to do than trawl through every house price index over the past month so luckily we’ve done it for you.
The Homeowners Alliance House Price Watch looks at all of the information from the various indices out there to give you one easy to digest round-up of everything you need to know.
Looking to buy or move home? Search for a cheaper mortgage today.
Sales are down and price rises are slowing
Looking across England and Wales, house prices are up on average 0.1% in the past month and 3.6% in the past year.
Interestingly, there are conflicting reports from the major house price indices with some reporting a rise in house prices and others reporting a fall in house prices over the past month.
Those reporting a decline in house prices include Halifax (-1%), Rightmove (-0.4%) and LSL (-0.2%).
Those reporting a rise in house prices include Nationwide (1%) and the Land Registry (0.5%).
But while prices are marginally up overall, home sales have slowed down.
Sales are down 3.3% between April and May, following a decrease of 3.2% between March and April 2017, based on analysis of all the various indices.
Transactions are up year on year but transactions in May 2016 were unusually low given the introduction of higher Stamp Duty rates on additional homes.
If you're looking to buy a home, why not have a read of our guide to buying when no one in your ideal neighbourhood is selling.
Winner and losers
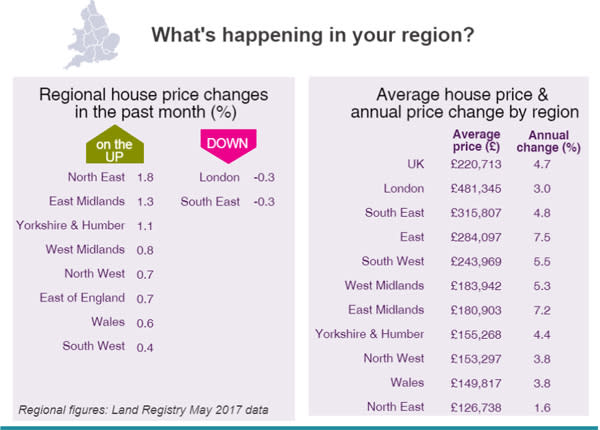
Looking Regionally, the East of England (7.5%) and the East Midlands (7.2%) come out on top with the highest rates of house price growth at 7.5% and 7.2% respectively.
It’s a gloomier picture for the North East and London, which achieved the slowest rates of annual house price growth at 1.6% for the North East and 3% in the capital.
Other regions are experiencing annual house price growth in the range of 3.5% – 5.5% with less disparity in rates of regional house price growth than we have seen in recent years.
Take a look at the table below to see how your region fared – if the table's too small, simply click on it to see a larger version.
First-time buyers fighting back
2017 has been a more successful one for first-timers so far.
The number of first-time buyers is up 5.5% year on year (162,704 vs 154,200) comparing the first six months of 2017 to 2016, according to the Halifax First Time Buyer Review.
Rightmove reports the first-time buyer sector with 1-2 bedrooms to be the fastest growing sector, with newly listed prices are up 3.5% month-on-month and 5.5% year-on-year.
Commenting on the data, Katherine Binns, director at Homeowners Alliance, says: “As anticipated the ongoing climate of political and economic uncertainty is causing an overall slowdown in the housing market.
“There are signs that the balance is shifting towards a buyer’s market and first-time buyers, not worried about selling their own property, seem to be forging ahead while mortgage rates remain attractive and their bargaining power is better than it has been in recent years.”
Compare mortgage rates: see if you could save
What the indices say
Nationwide
“The emerging squeeze on household incomes appears to be exerting a drag on housing market activity in recent months.
The number of mortgages approved for house purchase has slowed a little in recent months and surveyors report that new buyer enquiries have softened.”
RICS
“Perhaps not surprisingly in the current environment, the term ‘uncertainty’ is featuring more heavily in feedback we are receiving from professionals working in the sector.
This seems to be exerting itself on transaction levels which are flatlining and may continue to do so for a while particularly given the ongoing challenge presented by the low level of stock on the market.”
Rightmove:
“It now seems certain that we will have continuing political uncertainty which the housing market traditionally dislikes and with the first fall in June prices for eight years there is no doubt the lack of stability is a factor.
Those at the traditional starter level are brushing aside uncertainty with demand being fuelled by the ongoing desire for homeownership, Government assistance and mortgage repayments often cheaper than rent for a similar property.”
Be in with a chance of winning £500 every week with loveMONEY! Click here to find out more
