
 Yahoo Finance
 Under The Bonnet, Computacenter's (LON:CCC) Returns Look Impressive
If we want to find a potential multi-bagger, often there are underlying trends that can provide clues. In a perfect world, we'd like to see a company investing more capital into its business and ideally the returns earned from that capital are also increasing. Ultimately, this demonstrates that it's a business that is reinvesting profits at increasing rates of return. Speaking of which, we noticed some great changes in Computacenter's (LON:CCC) returns on capital, so let's have a look.
Understanding Return On Capital Employed (ROCE)
For those who don't know, ROCE is a measure of a company's yearly pre-tax profit (its return), relative to the capital employed in the business. To calculate this metric for Computacenter, this is the formula:
Return on Capital Employed = Earnings Before Interest and Tax (EBIT) ÷ (Total Assets - Current Liabilities)
0.24 = UK£264m ÷ (UK£3.1b - UK£2.0b) (Based on the trailing twelve months to December 2023).
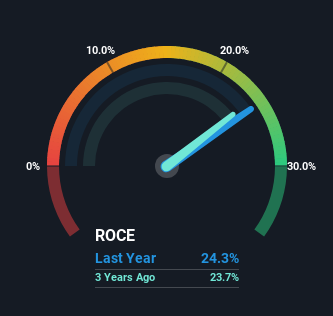
So, Computacenter has an ROCE of 24%. That's a fantastic return and not only that, it outpaces the average of 12% earned by companies in a similar industry.
View our latest analysis for Computacenter
In the above chart we have measured Computacenter's prior ROCE against its prior performance, but the future is arguably more important. If you'd like, you can check out the forecasts from the analysts covering Computacenter for free.
What Can We Tell From Computacenter's ROCE Trend?
We like the trends that we're seeing from Computacenter. Over the last five years, returns on capital employed have risen substantially to 24%. The amount of capital employed has increased too, by 78%. The increasing returns on a growing amount of capital is common amongst multi-baggers and that's why we're impressed.
On a separate but related note, it's important to know that Computacenter has a current liabilities to total assets ratio of 64%, which we'd consider pretty high. This can bring about some risks because the company is basically operating with a rather large reliance on its suppliers or other sorts of short-term creditors. While it's not necessarily a bad thing, it can be beneficial if this ratio is lower.
Our Take On Computacenter's ROCE
All in all, it's terrific to see that Computacenter is reaping the rewards from prior investments and is growing its capital base. And a remarkable 175% total return over the last five years tells us that investors are expecting more good things to come in the future. In light of that, we think it's worth looking further into this stock because if Computacenter can keep these trends up, it could have a bright future ahead.
If you'd like to know about the risks facing Computacenter, we've discovered 1 warning sign that you should be aware of.
Computacenter is not the only stock earning high returns. If you'd like to see more, check out our free list of companies earning high returns on equity with solid fundamentals.
Have feedback on this article? Concerned about the content? Get in touch with us directly. Alternatively, email editorial-team (at) simplywallst.com.
This article by Simply Wall St is general in nature. We provide commentary based on historical data and analyst forecasts only using an unbiased methodology and our articles are not intended to be financial advice. It does not constitute a recommendation to buy or sell any stock, and does not take account of your objectives, or your financial situation. We aim to bring you long-term focused analysis driven by fundamental data. Note that our analysis may not factor in the latest price-sensitive company announcements or qualitative material. Simply Wall St has no position in any stocks mentioned.
