
 Yahoo Finance
 Under The Bonnet, Fortinet's (NASDAQ:FTNT) Returns Look Impressive
To find a multi-bagger stock, what are the underlying trends we should look for in a business? In a perfect world, we'd like to see a company investing more capital into its business and ideally the returns earned from that capital are also increasing. Put simply, these types of businesses are compounding machines, meaning they are continually reinvesting their earnings at ever-higher rates of return. With that in mind, the ROCE of Fortinet (NASDAQ:FTNT) looks great, so lets see what the trend can tell us.
Return On Capital Employed (ROCE): What Is It?
For those who don't know, ROCE is a measure of a company's yearly pre-tax profit (its return), relative to the capital employed in the business. To calculate this metric for Fortinet, this is the formula:
Return on Capital Employed = Earnings Before Interest and Tax (EBIT) ÷ (Total Assets - Current Liabilities)
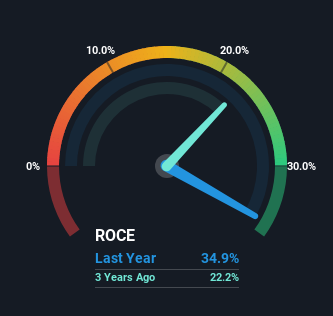
0.35 = US$1.2b ÷ (US$7.3b - US$3.7b) (Based on the trailing twelve months to December 2023).
Therefore, Fortinet has an ROCE of 35%. In absolute terms that's a great return and it's even better than the Software industry average of 7.2%.
Check out our latest analysis for Fortinet
Above you can see how the current ROCE for Fortinet compares to its prior returns on capital, but there's only so much you can tell from the past. If you'd like, you can check out the forecasts from the analysts covering Fortinet for free.
So How Is Fortinet's ROCE Trending?
Investors would be pleased with what's happening at Fortinet. The data shows that returns on capital have increased substantially over the last five years to 35%. The company is effectively making more money per dollar of capital used, and it's worth noting that the amount of capital has increased too, by 94%. So we're very much inspired by what we're seeing at Fortinet thanks to its ability to profitably reinvest capital.
For the record though, there was a noticeable increase in the company's current liabilities over the period, so we would attribute some of the ROCE growth to that. Effectively this means that suppliers or short-term creditors are now funding 51% of the business, which is more than it was five years ago. Given it's pretty high ratio, we'd remind investors that having current liabilities at those levels can bring about some risks in certain businesses.
The Bottom Line On Fortinet's ROCE
In summary, it's great to see that Fortinet can compound returns by consistently reinvesting capital at increasing rates of return, because these are some of the key ingredients of those highly sought after multi-baggers. And with the stock having performed exceptionally well over the last five years, these patterns are being accounted for by investors. In light of that, we think it's worth looking further into this stock because if Fortinet can keep these trends up, it could have a bright future ahead.
Fortinet does come with some risks though, we found 2 warning signs in our investment analysis, and 1 of those can't be ignored...
If you want to search for more stocks that have been earning high returns, check out this free list of stocks with solid balance sheets that are also earning high returns on equity.
Have feedback on this article? Concerned about the content? Get in touch with us directly. Alternatively, email editorial-team (at) simplywallst.com.
This article by Simply Wall St is general in nature. We provide commentary based on historical data and analyst forecasts only using an unbiased methodology and our articles are not intended to be financial advice. It does not constitute a recommendation to buy or sell any stock, and does not take account of your objectives, or your financial situation. We aim to bring you long-term focused analysis driven by fundamental data. Note that our analysis may not factor in the latest price-sensitive company announcements or qualitative material. Simply Wall St has no position in any stocks mentioned.
