
 Yahoo Finance
 We Like These Underlying Return On Capital Trends At AIREA (LON:AIEA)
If we want to find a potential multi-bagger, often there are underlying trends that can provide clues. Firstly, we'd want to identify a growing return on capital employed (ROCE) and then alongside that, an ever-increasing base of capital employed. Put simply, these types of businesses are compounding machines, meaning they are continually reinvesting their earnings at ever-higher rates of return. So on that note, AIREA (LON:AIEA) looks quite promising in regards to its trends of return on capital.
Return On Capital Employed (ROCE): What is it?
If you haven't worked with ROCE before, it measures the 'return' (pre-tax profit) a company generates from capital employed in its business. Analysts use this formula to calculate it for AIREA:
Return on Capital Employed = Earnings Before Interest and Tax (EBIT) ÷ (Total Assets - Current Liabilities)
0.04 = UK£888k ÷ (UK£27m - UK£5.3m) (Based on the trailing twelve months to June 2021).
Therefore, AIREA has an ROCE of 4.0%. Ultimately, that's a low return and it under-performs the Consumer Durables industry average of 6.2%.
See our latest analysis for AIREA
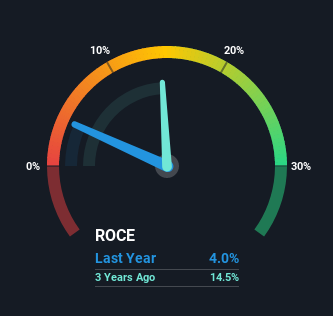
Historical performance is a great place to start when researching a stock so above you can see the gauge for AIREA's ROCE against it's prior returns. If you want to delve into the historical earnings, revenue and cash flow of AIREA, check out these free graphs here.
The Trend Of ROCE
We're delighted to see that AIREA is reaping rewards from its investments and has now broken into profitability. While the business was unprofitable in the past, it's now turned things around and is earning 4.0% on its capital. Interestingly, the capital employed by the business has remained relatively flat, so these higher returns are either from prior investments paying off or increased efficiencies. So while we're happy that the business is more efficient, just keep in mind that could mean that going forward the business is lacking areas to invest internally for growth. Because in the end, a business can only get so efficient.
What We Can Learn From AIREA's ROCE
In summary, we're delighted to see that AIREA has been able to increase efficiencies and earn higher rates of return on the same amount of capital. Since the stock has returned a staggering 144% to shareholders over the last five years, it looks like investors are recognizing these changes. In light of that, we think it's worth looking further into this stock because if AIREA can keep these trends up, it could have a bright future ahead.
AIREA does have some risks, we noticed 2 warning signs (and 1 which can't be ignored) we think you should know about.
For those who like to invest in solid companies, check out this free list of companies with solid balance sheets and high returns on equity.
This article by Simply Wall St is general in nature. We provide commentary based on historical data and analyst forecasts only using an unbiased methodology and our articles are not intended to be financial advice. It does not constitute a recommendation to buy or sell any stock, and does not take account of your objectives, or your financial situation. We aim to bring you long-term focused analysis driven by fundamental data. Note that our analysis may not factor in the latest price-sensitive company announcements or qualitative material. Simply Wall St has no position in any stocks mentioned.
Have feedback on this article? Concerned about the content? Get in touch with us directly. Alternatively, email editorial-team (at) simplywallst.com.
