
 Yahoo Finance
 We Like These Underlying Return On Capital Trends At Balfour Beatty (LON:BBY)
To find a multi-bagger stock, what are the underlying trends we should look for in a business? One common approach is to try and find a company with returns on capital employed (ROCE) that are increasing, in conjunction with a growing amount of capital employed. This shows us that it's a compounding machine, able to continually reinvest its earnings back into the business and generate higher returns. With that in mind, we've noticed some promising trends at Balfour Beatty (LON:BBY) so let's look a bit deeper.
Understanding Return On Capital Employed (ROCE)
Just to clarify if you're unsure, ROCE is a metric for evaluating how much pre-tax income (in percentage terms) a company earns on the capital invested in its business. To calculate this metric for Balfour Beatty, this is the formula:
Return on Capital Employed = Earnings Before Interest and Tax (EBIT) ÷ (Total Assets - Current Liabilities)
0.011 = UK£28m ÷ (UK£5.1b - UK£2.6b) (Based on the trailing twelve months to July 2022).
Thus, Balfour Beatty has an ROCE of 1.1%. In absolute terms, that's a low return and it also under-performs the Construction industry average of 8.9%.
See our latest analysis for Balfour Beatty
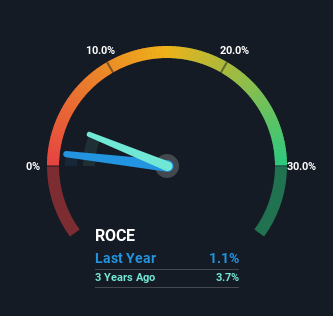
Above you can see how the current ROCE for Balfour Beatty compares to its prior returns on capital, but there's only so much you can tell from the past. If you'd like to see what analysts are forecasting going forward, you should check out our free report for Balfour Beatty.
What The Trend Of ROCE Can Tell Us
Even though ROCE is still low in absolute terms, it's good to see it's heading in the right direction. More specifically, while the company has kept capital employed relatively flat over the last five years, the ROCE has climbed 116% in that same time. So our take on this is that the business has increased efficiencies to generate these higher returns, all the while not needing to make any additional investments. On that front, things are looking good so it's worth exploring what management has said about growth plans going forward.
On a separate but related note, it's important to know that Balfour Beatty has a current liabilities to total assets ratio of 51%, which we'd consider pretty high. This can bring about some risks because the company is basically operating with a rather large reliance on its suppliers or other sorts of short-term creditors. While it's not necessarily a bad thing, it can be beneficial if this ratio is lower.
The Key Takeaway
To bring it all together, Balfour Beatty has done well to increase the returns it's generating from its capital employed. Investors may not be impressed by the favorable underlying trends yet because over the last five years the stock has only returned 27% to shareholders. So with that in mind, we think the stock deserves further research.
On a final note, we found 3 warning signs for Balfour Beatty (1 is a bit unpleasant) you should be aware of.
If you want to search for solid companies with great earnings, check out this free list of companies with good balance sheets and impressive returns on equity.
Have feedback on this article? Concerned about the content? Get in touch with us directly. Alternatively, email editorial-team (at) simplywallst.com.
This article by Simply Wall St is general in nature. We provide commentary based on historical data and analyst forecasts only using an unbiased methodology and our articles are not intended to be financial advice. It does not constitute a recommendation to buy or sell any stock, and does not take account of your objectives, or your financial situation. We aim to bring you long-term focused analysis driven by fundamental data. Note that our analysis may not factor in the latest price-sensitive company announcements or qualitative material. Simply Wall St has no position in any stocks mentioned.
Join A Paid User Research Session
You’ll receive a US$30 Amazon Gift card for 1 hour of your time while helping us build better investing tools for the individual investors like yourself. Sign up here
