
 Yahoo Finance
 We Like These Underlying Return On Capital Trends At Netcall (LON:NET)
If we want to find a stock that could multiply over the long term, what are the underlying trends we should look for? Typically, we'll want to notice a trend of growing return on capital employed (ROCE) and alongside that, an expanding base of capital employed. Put simply, these types of businesses are compounding machines, meaning they are continually reinvesting their earnings at ever-higher rates of return. Speaking of which, we noticed some great changes in Netcall's (LON:NET) returns on capital, so let's have a look.
What Is Return On Capital Employed (ROCE)?
For those who don't know, ROCE is a measure of a company's yearly pre-tax profit (its return), relative to the capital employed in the business. The formula for this calculation on Netcall is:
Return on Capital Employed = Earnings Before Interest and Tax (EBIT) ÷ (Total Assets - Current Liabilities)
0.12 = UK£4.8m ÷ (UK£68m - UK£28m) (Based on the trailing twelve months to December 2023).
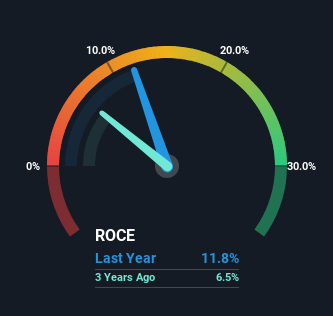
Therefore, Netcall has an ROCE of 12%. In absolute terms, that's a satisfactory return, but compared to the Software industry average of 9.1% it's much better.
View our latest analysis for Netcall
Above you can see how the current ROCE for Netcall compares to its prior returns on capital, but there's only so much you can tell from the past. If you're interested, you can view the analysts predictions in our free analyst report for Netcall .
What Can We Tell From Netcall's ROCE Trend?
We like the trends that we're seeing from Netcall. The data shows that returns on capital have increased substantially over the last five years to 12%. The company is effectively making more money per dollar of capital used, and it's worth noting that the amount of capital has increased too, by 39%. So we're very much inspired by what we're seeing at Netcall thanks to its ability to profitably reinvest capital.
On a separate but related note, it's important to know that Netcall has a current liabilities to total assets ratio of 41%, which we'd consider pretty high. This effectively means that suppliers (or short-term creditors) are funding a large portion of the business, so just be aware that this can introduce some elements of risk. Ideally we'd like to see this reduce as that would mean fewer obligations bearing risks.
The Key Takeaway
A company that is growing its returns on capital and can consistently reinvest in itself is a highly sought after trait, and that's what Netcall has. And investors seem to expect more of this going forward, since the stock has rewarded shareholders with a 92% return over the last five years. In light of that, we think it's worth looking further into this stock because if Netcall can keep these trends up, it could have a bright future ahead.
One more thing to note, we've identified 2 warning signs with Netcall and understanding these should be part of your investment process.
While Netcall may not currently earn the highest returns, we've compiled a list of companies that currently earn more than 25% return on equity. Check out this free list here.
Have feedback on this article? Concerned about the content? Get in touch with us directly. Alternatively, email editorial-team (at) simplywallst.com.
This article by Simply Wall St is general in nature. We provide commentary based on historical data and analyst forecasts only using an unbiased methodology and our articles are not intended to be financial advice. It does not constitute a recommendation to buy or sell any stock, and does not take account of your objectives, or your financial situation. We aim to bring you long-term focused analysis driven by fundamental data. Note that our analysis may not factor in the latest price-sensitive company announcements or qualitative material. Simply Wall St has no position in any stocks mentioned.
