
 Yahoo Finance
 We Like These Underlying Return On Capital Trends At Parkmead Group (LON:PMG)
What trends should we look for it we want to identify stocks that can multiply in value over the long term? In a perfect world, we'd like to see a company investing more capital into its business and ideally the returns earned from that capital are also increasing. Put simply, these types of businesses are compounding machines, meaning they are continually reinvesting their earnings at ever-higher rates of return. So on that note, Parkmead Group (LON:PMG) looks quite promising in regards to its trends of return on capital.
What Is Return On Capital Employed (ROCE)?
If you haven't worked with ROCE before, it measures the 'return' (pre-tax profit) a company generates from capital employed in its business. Analysts use this formula to calculate it for Parkmead Group:
Return on Capital Employed = Earnings Before Interest and Tax (EBIT) ÷ (Total Assets - Current Liabilities)
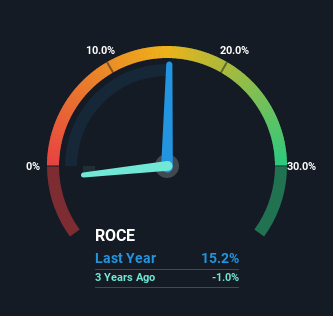
0.15 = UK£8.0m ÷ (UK£70m - UK£18m) (Based on the trailing twelve months to December 2022).
Therefore, Parkmead Group has an ROCE of 15%. That's a relatively normal return on capital, and it's around the 13% generated by the Oil and Gas industry.
Check out our latest analysis for Parkmead Group
Above you can see how the current ROCE for Parkmead Group compares to its prior returns on capital, but there's only so much you can tell from the past. If you'd like to see what analysts are forecasting going forward, you should check out our free report for Parkmead Group.
So How Is Parkmead Group's ROCE Trending?
It's great to see that Parkmead Group has started to generate some pre-tax earnings from prior investments. Historically the company was generating losses but as we can see from the latest figures referenced above, they're now earning 15% on their capital employed. Additionally, the business is utilizing 28% less capital than it was five years ago, and taken at face value, that can mean the company needs less funds at work to get a return. Parkmead Group could be selling under-performing assets since the ROCE is improving.
On a side note, we noticed that the improvement in ROCE appears to be partly fueled by an increase in current liabilities. Essentially the business now has suppliers or short-term creditors funding about 26% of its operations, which isn't ideal. It's worth keeping an eye on this because as the percentage of current liabilities to total assets increases, some aspects of risk also increase.
The Bottom Line
In a nutshell, we're pleased to see that Parkmead Group has been able to generate higher returns from less capital. Although the company may be facing some issues elsewhere since the stock has plunged 73% in the last five years. Still, it's worth doing some further research to see if the trends will continue into the future.
If you'd like to know about the risks facing Parkmead Group, we've discovered 3 warning signs that you should be aware of.
If you want to search for solid companies with great earnings, check out this free list of companies with good balance sheets and impressive returns on equity.
Have feedback on this article? Concerned about the content? Get in touch with us directly. Alternatively, email editorial-team (at) simplywallst.com.
This article by Simply Wall St is general in nature. We provide commentary based on historical data and analyst forecasts only using an unbiased methodology and our articles are not intended to be financial advice. It does not constitute a recommendation to buy or sell any stock, and does not take account of your objectives, or your financial situation. We aim to bring you long-term focused analysis driven by fundamental data. Note that our analysis may not factor in the latest price-sensitive company announcements or qualitative material. Simply Wall St has no position in any stocks mentioned.
Join A Paid User Research Session
You’ll receive a US$30 Amazon Gift card for 1 hour of your time while helping us build better investing tools for the individual investors like yourself. Sign up here
