
 Yahoo Finance
 We Like These Underlying Return On Capital Trends At R.E.A. Holdings (LON:RE.)
If you're not sure where to start when looking for the next multi-bagger, there are a few key trends you should keep an eye out for. In a perfect world, we'd like to see a company investing more capital into its business and ideally the returns earned from that capital are also increasing. If you see this, it typically means it's a company with a great business model and plenty of profitable reinvestment opportunities. So on that note, R.E.A. Holdings (LON:RE.) looks quite promising in regards to its trends of return on capital.
What is Return On Capital Employed (ROCE)?
Just to clarify if you're unsure, ROCE is a metric for evaluating how much pre-tax income (in percentage terms) a company earns on the capital invested in its business. Analysts use this formula to calculate it for R.E.A. Holdings:
Return on Capital Employed = Earnings Before Interest and Tax (EBIT) ÷ (Total Assets - Current Liabilities)
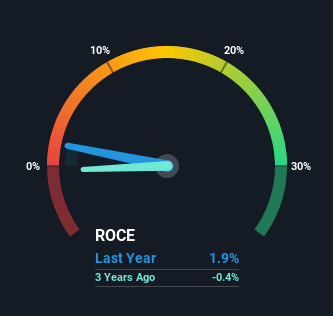
0.019 = US$8.8m ÷ (US$574m - US$113m) (Based on the trailing twelve months to December 2020).
Thus, R.E.A. Holdings has an ROCE of 1.9%. In absolute terms, that's a low return and it also under-performs the Food industry average of 8.3%.
See our latest analysis for R.E.A. Holdings
While the past is not representative of the future, it can be helpful to know how a company has performed historically, which is why we have this chart above. If you'd like to look at how R.E.A. Holdings has performed in the past in other metrics, you can view this free graph of past earnings, revenue and cash flow.
How Are Returns Trending?
We're delighted to see that R.E.A. Holdings is reaping rewards from its investments and has now broken into profitability. The company was generating losses five years ago, but has managed to turn it around and as we saw earlier is now earning 1.9%, which is always encouraging. On top of that, what's interesting is that the amount of capital being employed has remained steady, so the business hasn't needed to put any additional money to work to generate these higher returns. That being said, while an increase in efficiency is no doubt appealing, it'd be helpful to know if the company does have any investment plans going forward. After all, a company can only become a long term multi-bagger if it continually reinvests in itself at high rates of return.
What We Can Learn From R.E.A. Holdings' ROCE
To sum it up, R.E.A. Holdings is collecting higher returns from the same amount of capital, and that's impressive. And since the stock has dived 75% over the last five years, there may be other factors affecting the company's prospects. Still, it's worth doing some further research to see if the trends will continue into the future.
On a separate note, we've found 1 warning sign for R.E.A. Holdings you'll probably want to know about.
While R.E.A. Holdings may not currently earn the highest returns, we've compiled a list of companies that currently earn more than 25% return on equity. Check out this free list here.
This article by Simply Wall St is general in nature. We provide commentary based on historical data and analyst forecasts only using an unbiased methodology and our articles are not intended to be financial advice. It does not constitute a recommendation to buy or sell any stock, and does not take account of your objectives, or your financial situation. We aim to bring you long-term focused analysis driven by fundamental data. Note that our analysis may not factor in the latest price-sensitive company announcements or qualitative material. Simply Wall St has no position in any stocks mentioned.
Have feedback on this article? Concerned about the content? Get in touch with us directly. Alternatively, email editorial-team (at) simplywallst.com.
