
 Yahoo Finance
 We Like These Underlying Return On Capital Trends At Telecom Plus (LON:TEP)
If we want to find a potential multi-bagger, often there are underlying trends that can provide clues. Ideally, a business will show two trends; firstly a growing return on capital employed (ROCE) and secondly, an increasing amount of capital employed. Ultimately, this demonstrates that it's a business that is reinvesting profits at increasing rates of return. With that in mind, we've noticed some promising trends at Telecom Plus (LON:TEP) so let's look a bit deeper.
What Is Return On Capital Employed (ROCE)?
If you haven't worked with ROCE before, it measures the 'return' (pre-tax profit) a company generates from capital employed in its business. The formula for this calculation on Telecom Plus is:
Return on Capital Employed = Earnings Before Interest and Tax (EBIT) ÷ (Total Assets - Current Liabilities)
0.19 = UK£58m ÷ (UK£517m - UK£206m) (Based on the trailing twelve months to September 2022).
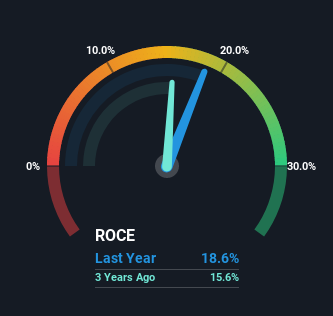
So, Telecom Plus has an ROCE of 19%. On its own, that's a standard return, however it's much better than the 5.0% generated by the Integrated Utilities industry.
See our latest analysis for Telecom Plus
Above you can see how the current ROCE for Telecom Plus compares to its prior returns on capital, but there's only so much you can tell from the past. If you're interested, you can view the analysts predictions in our free report on analyst forecasts for the company.
What Does the ROCE Trend For Telecom Plus Tell Us?
Telecom Plus is showing promise given that its ROCE is trending up and to the right. The figures show that over the last five years, ROCE has grown 31% whilst employing roughly the same amount of capital. Basically the business is generating higher returns from the same amount of capital and that is proof that there are improvements in the company's efficiencies. It's worth looking deeper into this though because while it's great that the business is more efficient, it might also mean that going forward the areas to invest internally for the organic growth are lacking.
For the record though, there was a noticeable increase in the company's current liabilities over the period, so we would attribute some of the ROCE growth to that. Effectively this means that suppliers or short-term creditors are now funding 40% of the business, which is more than it was five years ago. It's worth keeping an eye on this because as the percentage of current liabilities to total assets increases, some aspects of risk also increase.
In Conclusion...
As discussed above, Telecom Plus appears to be getting more proficient at generating returns since capital employed has remained flat but earnings (before interest and tax) are up. And with a respectable 80% awarded to those who held the stock over the last five years, you could argue that these developments are starting to get the attention they deserve. In light of that, we think it's worth looking further into this stock because if Telecom Plus can keep these trends up, it could have a bright future ahead.
One more thing to note, we've identified 2 warning signs with Telecom Plus and understanding them should be part of your investment process.
If you want to search for solid companies with great earnings, check out this free list of companies with good balance sheets and impressive returns on equity.
Have feedback on this article? Concerned about the content? Get in touch with us directly. Alternatively, email editorial-team (at) simplywallst.com.
This article by Simply Wall St is general in nature. We provide commentary based on historical data and analyst forecasts only using an unbiased methodology and our articles are not intended to be financial advice. It does not constitute a recommendation to buy or sell any stock, and does not take account of your objectives, or your financial situation. We aim to bring you long-term focused analysis driven by fundamental data. Note that our analysis may not factor in the latest price-sensitive company announcements or qualitative material. Simply Wall St has no position in any stocks mentioned.
Join A Paid User Research Session
You’ll receive a US$30 Amazon Gift card for 1 hour of your time while helping us build better investing tools for the individual investors like yourself. Sign up here
