
 Yahoo Finance
 Is UNIQA Insurance Group AG's (VIE:UQA) P/E Ratio Really That Good?

Today, we'll introduce the concept of the P/E ratio for those who are learning about investing. To keep it practical, we'll show how UNIQA Insurance Group AG's (VIE:UQA) P/E ratio could help you assess the value on offer. UNIQA Insurance Group has a price to earnings ratio of 10.98, based on the last twelve months. That is equivalent to an earnings yield of about 9.1%.
View our latest analysis for UNIQA Insurance Group
How Do You Calculate A P/E Ratio?
The formula for price to earnings is:
Price to Earnings Ratio = Price per Share ÷ Earnings per Share (EPS)
Or for UNIQA Insurance Group:
P/E of 10.98 = €8.47 ÷ €0.77 (Based on the year to June 2019.)
Is A High Price-to-Earnings Ratio Good?
A higher P/E ratio implies that investors pay a higher price for the earning power of the business. All else being equal, it's better to pay a low price -- but as Warren Buffett said, 'It's far better to buy a wonderful company at a fair price than a fair company at a wonderful price.'
Does UNIQA Insurance Group Have A Relatively High Or Low P/E For Its Industry?
The P/E ratio indicates whether the market has higher or lower expectations of a company. If you look at the image below, you can see UNIQA Insurance Group has a lower P/E than the average (12.5) in the insurance industry classification.
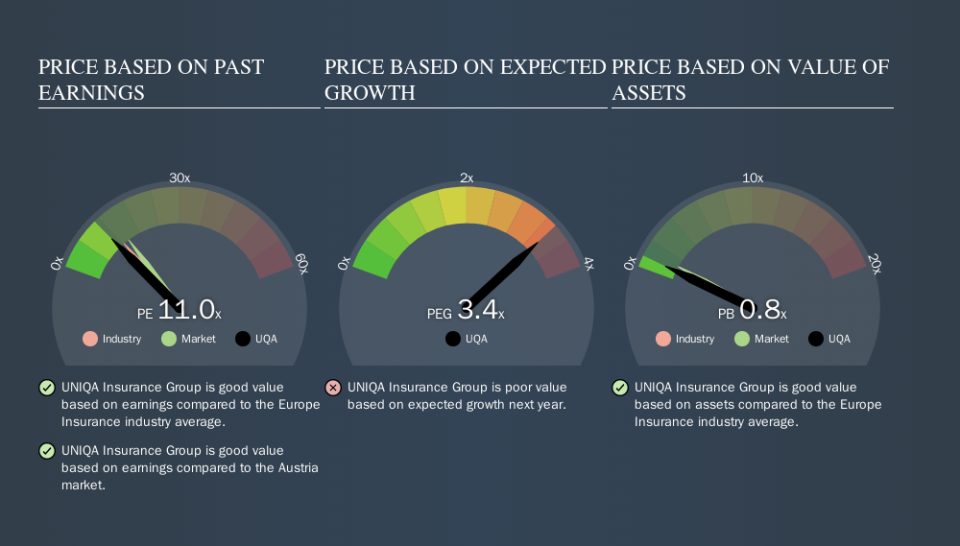
Its relatively low P/E ratio indicates that UNIQA Insurance Group shareholders think it will struggle to do as well as other companies in its industry classification. While current expectations are low, the stock could be undervalued if the situation is better than the market assumes. You should delve deeper. I like to check if company insiders have been buying or selling.
How Growth Rates Impact P/E Ratios
P/E ratios primarily reflect market expectations around earnings growth rates. When earnings grow, the 'E' increases, over time. That means unless the share price increases, the P/E will reduce in a few years. A lower P/E should indicate the stock is cheap relative to others -- and that may attract buyers.
UNIQA Insurance Group saw earnings per share decrease by 2.4% last year. But it has grown its earnings per share by 1.0% per year over the last five years.
Remember: P/E Ratios Don't Consider The Balance Sheet
The 'Price' in P/E reflects the market capitalization of the company. That means it doesn't take debt or cash into account. Theoretically, a business can improve its earnings (and produce a lower P/E in the future) by investing in growth. That means taking on debt (or spending its cash).
While growth expenditure doesn't always pay off, the point is that it is a good option to have; but one that the P/E ratio ignores.
UNIQA Insurance Group's Balance Sheet
UNIQA Insurance Group's net debt is 3.9% of its market cap. So it doesn't have as many options as it would with net cash, but its debt would not have much of an impact on its P/E ratio.
The Bottom Line On UNIQA Insurance Group's P/E Ratio
UNIQA Insurance Group's P/E is 11 which is below average (14.6) in the AT market. With only modest debt, it's likely the lack of EPS growth at least partially explains the pessimism implied by the P/E ratio.
Investors should be looking to buy stocks that the market is wrong about. If the reality for a company is not as bad as the P/E ratio indicates, then the share price should increase as the market realizes this. So this free visual report on analyst forecasts could hold the key to an excellent investment decision.
You might be able to find a better buy than UNIQA Insurance Group. If you want a selection of possible winners, check out this free list of interesting companies that trade on a P/E below 20 (but have proven they can grow earnings).
We aim to bring you long-term focused research analysis driven by fundamental data. Note that our analysis may not factor in the latest price-sensitive company announcements or qualitative material.
If you spot an error that warrants correction, please contact the editor at editorial-team@simplywallst.com. This article by Simply Wall St is general in nature. It does not constitute a recommendation to buy or sell any stock, and does not take account of your objectives, or your financial situation. Simply Wall St has no position in the stocks mentioned. Thank you for reading.
