
 Yahoo Finance
 United Continental (UAL) Down 3% Since Earnings Report: Can It Rebound?

It has been about a month since the last earnings report for United Continental Holdings, Inc. UAL. Shares have lost about 3% in that time frame, outperforming the market.
Will the recent negative trend continue leading up to its next earnings release, or is UAL due for a breakout? Before we dive into how investors and analysts have reacted of late, let's take a quick look at its most recent earnings report in order to get a better handle on the important drivers.
Fourth Quarter Earnings
The company’s earnings (excluding 59 cents from non-recurring items) came in at $1.40 per share, beating the Zacks Consensus Estimate of $1.34. The bottom line was however, 21.4% lower than the year-ago figure due to higher costs.
Operating revenues of $9,438 million in the fourth quarter were also ahead of the Zacks Consensus Estimate of $9,427.9 million. The top line also increased 4.3% year over year.
Operating Results
The company reported a marginal year-over-year rise in consolidated passenger revenue per available seat mile (PRASM: a key measure of unit revenues) to 12.43 cents.
Yield on a consolidated basis inched up 0.9% from the fourth quarter of 2016 while passenger revenues climbed 4.1% to $8,080 million. Cargo revenues increased 21.6% and other revenues grew 1.2% in the said time frame. Higher international freight volumes and yields boosted cargo revenues in the quarter.
During the reported quarter, airline traffic measured in revenue passenger miles, improved 3.1% year over year on a consolidated basis. Capacity (or available seat miles) rose 4%. Load factor (percentage of seat occupancy) declined 70 basis points to 81.7% as capacity expansion outpaced traffic growth. Average fuel price per gallon (on a consolidated basis) excluding hedge loss escalated 19.4% year over year to $1.91.
Total operating expenses jumped 8.2% year over year to $8.7 billion. Consolidated unit cost or cost per available seat mile (CASM) — excluding fuel, third-party business expenses and profit sharing — nudged up 1.5% year over year, primarily on the labor deals inked by the company.
Liquidity
United Continental exited the fourth quarter with $5.8 billion in unrestricted liquidity, which included $2 billion of undrawn commitments under its revolving credit facility. The company generated $728 million as operating cash flow in the quarter under discussion. Free cash outflow (adjusted) at the end of the quarter was $318 million.
Expansion and Fleet Upgrade Efforts in 2017
The company, constantly looking to grow and upgrade its fleet, made a substantial progress in expansion and fleet upgrade during 2017. The company announced 44 new domestic routes from seven of its mainland hubs and increased frequency on 11 routes to the Hawaiian Islands. Additionally, the carrier announced 13 new global routes last year.
During the same period, the airline took delivery of 19 Boeing aircrafts, including 12 777-300ER, three 787-9 and four 737-800. Also, eight used Airbus aircrafts including two A320 and six A319 were purchased by the company.
The carrier has also announced an agreement with Airbus for changes in its A350 order. The contract calls for conversion of the model type from A350-1000 to A350-900, an increase in the order size from 35 to 45 aircrafts and a postponement of the first delivery to 2022. On another agreement announced with Boeing, the company wishes to convert 100 of its existing 737 MAX orders into 737 MAX 10 aircrafts, beginning late 2020.
Q1 Guidance
For the first quarter of 2018, the carrier anticipates capacity to expand between 3.5% and 4.5%. Pre-tax margin (adjusted) is expected to be flat year over year. First-quarter consolidated passenger revenue per available seat mile (PRASM) is predicted to be flat to up 2% year over year. Consolidated cost per available seat mile (CASM) excluding third-party business expenses, fuel & profit sharing is estimated in the range of flat to up 1% in the first quarter. While first-quarter consolidated average aircraft fuel price per gallon is predicted at approximately $2.11. Additionally, Effective Income Tax Rate in the first quarter is expected between 22% and 24%.
2018 Outlook
For 2018, the company expects capacity to augment between 4% and 6% year over year. Moreover, a similar growth in the metric is forecast in 2019 and 2020.
How Have Estimates Been Moving Since Then?
In the past month, investors have witnessed an upward trend in fresh estimates. There have been three revisions higher for the current quarter compared to two lower. In the past month, the consensus estimate has shifted by 122.2% due to these changes.
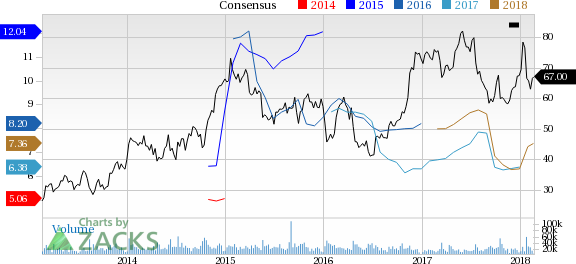
United Continental Holdings, Inc. Price and Consensus
United Continental Holdings, Inc. Price and Consensus | United Continental Holdings, Inc. Quote
VGM Scores
At this time, UAL has a subpar Growth Score of D, however its Momentum is doing a lot better with a B. The stock was allocated a grade of A on the value side, putting it in the top 20% for this investment strategy.
Overall, the stock has an aggregate VGM Score of B. If you aren't focused on one strategy, this score is the one you should be interested in.
Our style scores indicate that the stock is more suitable for value investors than momentum investors.
Outlook
Estimates have been broadly trending upward for the stock and the magnitude of these revisions looks promising. It comes with little surprise that UAL has a Zacks Rank #2 (Buy). We expect an above average return from the stock in the next few months.
Want the latest recommendations from Zacks Investment Research? Today, you can download 7 Best Stocks for the Next 30 Days. Click to get this free report
United Continental Holdings, Inc. (UAL) : Free Stock Analysis Report
To read this article on Zacks.com click here.
Zacks Investment Research
