
 Yahoo Finance
 United-Guardian (NASDAQ:UG) Could Be At Risk Of Shrinking As A Company
When researching a stock for investment, what can tell us that the company is in decline? More often than not, we'll see a declining return on capital employed (ROCE) and a declining amount of capital employed. Trends like this ultimately mean the business is reducing its investments and also earning less on what it has invested. On that note, looking into United-Guardian (NASDAQ:UG), we weren't too upbeat about how things were going.
Return On Capital Employed (ROCE): What Is It?
If you haven't worked with ROCE before, it measures the 'return' (pre-tax profit) a company generates from capital employed in its business. To calculate this metric for United-Guardian, this is the formula:
Return on Capital Employed = Earnings Before Interest and Tax (EBIT) ÷ (Total Assets - Current Liabilities)
0.25 = US$2.9m ÷ (US$13m - US$1.5m) (Based on the trailing twelve months to December 2023).
Thus, United-Guardian has an ROCE of 25%. In absolute terms that's a great return and it's even better than the Personal Products industry average of 14%.
See our latest analysis for United-Guardian
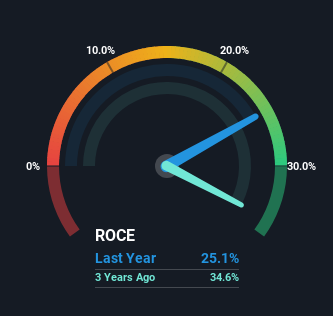
Historical performance is a great place to start when researching a stock so above you can see the gauge for United-Guardian's ROCE against it's prior returns. If you'd like to look at how United-Guardian has performed in the past in other metrics, you can view this free graph of United-Guardian's past earnings, revenue and cash flow.
The Trend Of ROCE
There is reason to be cautious about United-Guardian, given the returns are trending downwards. To be more specific, the ROCE was 50% five years ago, but since then it has dropped noticeably. On top of that, it's worth noting that the amount of capital employed within the business has remained relatively steady. Companies that exhibit these attributes tend to not be shrinking, but they can be mature and facing pressure on their margins from competition. So because these trends aren't typically conducive to creating a multi-bagger, we wouldn't hold our breath on United-Guardian becoming one if things continue as they have.
In Conclusion...
All in all, the lower returns from the same amount of capital employed aren't exactly signs of a compounding machine. It should come as no surprise then that the stock has fallen 45% over the last five years, so it looks like investors are recognizing these changes. That being the case, unless the underlying trends revert to a more positive trajectory, we'd consider looking elsewhere.
United-Guardian does come with some risks though, we found 3 warning signs in our investment analysis, and 1 of those is a bit unpleasant...
High returns are a key ingredient to strong performance, so check out our free list ofstocks earning high returns on equity with solid balance sheets.
Have feedback on this article? Concerned about the content? Get in touch with us directly. Alternatively, email editorial-team (at) simplywallst.com.
This article by Simply Wall St is general in nature. We provide commentary based on historical data and analyst forecasts only using an unbiased methodology and our articles are not intended to be financial advice. It does not constitute a recommendation to buy or sell any stock, and does not take account of your objectives, or your financial situation. We aim to bring you long-term focused analysis driven by fundamental data. Note that our analysis may not factor in the latest price-sensitive company announcements or qualitative material. Simply Wall St has no position in any stocks mentioned.
