
 Yahoo Finance
 United Rentals (URI) Q1 Earnings Lag, Revenues Top, Stock Down
United Rentals, Inc.’s URI shares declined 5.4% in the after-hours trading session on Apr 26, following first-quarter 2023 results. Its earnings missed the Zacks Consensus Estimate but revenues beat the same.
Nonetheless, on a year-over-year basis, earnings and revenues increased, courtesy of sustained demand in its end markets and the strength of its core rental business.
URI also reaffirmed its 2023 guidance, given broad-based end-market activity, contractor backlogs, customer sentiment and solid visibility. Also, it unveiled a quarterly dividend of $1.48 per share, with an annualized yield of approximately 0.4%. The company also repurchased $250 million of stock under its existing $1.25 billion share repurchase program.
United Rentals, Inc. Price, Consensus and EPS Surprise
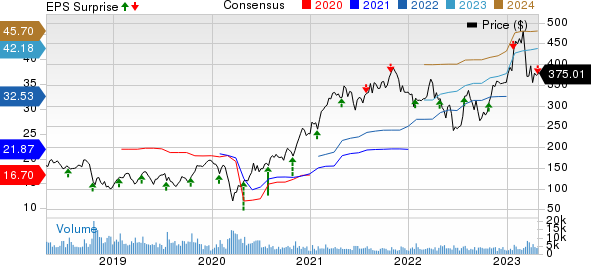
United Rentals, Inc. price-consensus-eps-surprise-chart | United Rentals, Inc. Quote
Inside the Headlines
Adjusted earnings of $7.95 per share missed the Zacks Consensus Estimate of $8.12 by 2.1%. The reported figure, however, increased 38.7% from the prior-year figure of $5.73 per share.
Total revenues of $3.285 billion surpassed the consensus mark of $3.14 billion by 4.7% and grew 30.2% year over year.
Rental revenues increased 26% from the year-ago quarter to $2.74 billion. This upside was mainly attributable to broad-based demand growth across end markets served by the company. Also, Ahern Rentals buyout contributed to the growth. Fleet productivity was up 2% and average original equipment costs increased 25.6% year over year.
Used equipment sales rose 83.9% from a year ago. Used equipment sales produced an adjusted gross margin of 59.5%, which expanded 170 basis points (bps) due to strong pricing.
Segment Discussion
General Rentals: This segment registered 26.7% year-over-year growth in rental revenues to $2.018 billion. Rental gross margin contracted 320 bps year over year to 32.9%, thanks to the Ahern Rentals acquisition.
Specialty (earlier known as Trench, Power and Pump): Segmental rental revenues increased 24.1% year over year to $722 million. Rentals gross margin expanded 260 bps on a year-over-year basis to 47.1%. This was backed by better cost performance and fixed cost absorption on higher revenues.
Margins
The company’s total equipment rentals gross margin fell 170 bps year over year to 36.6%. Adjusted EBITDA for the reported period grew 32% year over year to $1.5 billion. Adjusted EBITDA margin also increased 70 bps to 45.8%.
Balance Sheet
United Rentals had cash and cash equivalents of $99 million as of Mar 31, 2023, down from $106 million at 2022-end. Total liquidity was $2.655 billion at March-end. Long-term debt at 2022-end was $11.49 billion, up from $11.21 billion at 2022-end.
On Mar 31, 2023, the net leverage ratio was 1.9x compared to 2.0x on Dec 31, 2022. Return on invested capital increased 220 bps year over year and 40 bps sequentially to a record 13.1% for the trailing 12 months that ended Mar 31, 2023.
Cash from operating activities increased 6% year over year to $939 million in the first quarter. Free cash flow, including merger and restructuring-related payments, declined 16.4% year over year to $478 million for the quarter due to higher net rental capital expenditures.
2023 Guidance Reaffirmed
Total revenues are expected in the range of $13.7-$14.2 billion. Adjusted EBITDA is projected between $6.6 billion and $6.85 billion.
Net rental capital expenditure after gross purchases is projected within $2-$2.25 billion, indicating a decrease from $2.471 billion in 2022.
Net cash provided by operating activities is anticipated in the range of $4.4-$4.8 billion, suggesting a rise from $4.433 billion in 2022.
Free cash flow (excluding the impact of merger and restructuring-related payments) is expected in the range of $2.1-$2.35 billion compared with $1.768 billion reported in 2022.
Zacks Rank
Currently, URI carries a Zacks Rank #3 (Hold). You can see the complete list of today’s Zacks #1 Rank (Strong Buy) stocks here.
A Few Recent Releases
Watsco, Inc. WSO reported mixed first-quarter 2023 results, wherein earnings topped the Zacks Consensus Estimate but sales missed the same.
Notably, Watsco delivered record sales and navigated the regulatory transition to higher Seasonal Energy Efficiency Rating or SEER products across its markets. Sustainable market share gains, solid heat pumps sales, solid commercial business, product diversity, technology leadership and continued investment in technologies contributed to the growth.
Masco Corporation MAS reported better-than-expected results for first-quarter 2023. The top and bottom lines surpassed the Zacks Consensus Estimate. The company has been benefiting from strong pricing actions and operational improvements.
On the other hand, MAS’ adjusted earnings and net sales declined on a year-over-year basis due to supply-chain challenges and inflation headwinds.
Armstrong World Industries, Inc. AWI reported impressive results for first-quarter 2023, wherein earnings and net sales surpassed the Zacks Consensus Estimate and grew on a year-over-year basis.
The upside in AWI’s first-quarter results was driven by double-digit sales and adjusted EBITDA growth in the Mineral Fiber segment.
Want the latest recommendations from Zacks Investment Research? Today, you can download 7 Best Stocks for the Next 30 Days. Click to get this free report
Watsco, Inc. (WSO) : Free Stock Analysis Report
Masco Corporation (MAS) : Free Stock Analysis Report
Armstrong World Industries, Inc. (AWI) : Free Stock Analysis Report
United Rentals, Inc. (URI) : Free Stock Analysis Report
