
 Yahoo Finance
 United Utilities Group (LON:UU.) Hasn't Managed To Accelerate Its Returns
Did you know there are some financial metrics that can provide clues of a potential multi-bagger? In a perfect world, we'd like to see a company investing more capital into its business and ideally the returns earned from that capital are also increasing. This shows us that it's a compounding machine, able to continually reinvest its earnings back into the business and generate higher returns. Having said that, from a first glance at United Utilities Group (LON:UU.) we aren't jumping out of our chairs at how returns are trending, but let's have a deeper look.
What is Return On Capital Employed (ROCE)?
If you haven't worked with ROCE before, it measures the 'return' (pre-tax profit) a company generates from capital employed in its business. Analysts use this formula to calculate it for United Utilities Group:
Return on Capital Employed = Earnings Before Interest and Tax (EBIT) ÷ (Total Assets - Current Liabilities)
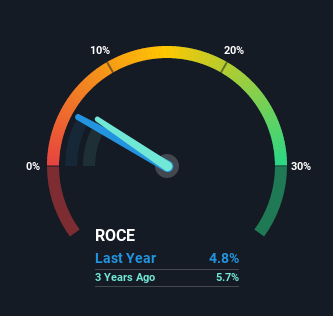
0.048 = UK£643m ÷ (UK£14b - UK£1.1b) (Based on the trailing twelve months to September 2021).
Therefore, United Utilities Group has an ROCE of 4.8%. On its own that's a low return on capital but it's in line with the industry's average returns of 4.8%.
See our latest analysis for United Utilities Group
In the above chart we have measured United Utilities Group's prior ROCE against its prior performance, but the future is arguably more important. If you'd like, you can check out the forecasts from the analysts covering United Utilities Group here for free.
What Does the ROCE Trend For United Utilities Group Tell Us?
Over the past five years, United Utilities Group's ROCE and capital employed have both remained mostly flat. Businesses with these traits tend to be mature and steady operations because they're past the growth phase. So unless we see a substantial change at United Utilities Group in terms of ROCE and additional investments being made, we wouldn't hold our breath on it being a multi-bagger. On top of that you'll notice that United Utilities Group has been paying out a large portion (96%) of earnings in the form of dividends to shareholders. Most shareholders probably know this and own the stock for its dividend.
The Bottom Line
In summary, United Utilities Group isn't compounding its earnings but is generating stable returns on the same amount of capital employed. Although the market must be expecting these trends to improve because the stock has gained 55% over the last five years. But if the trajectory of these underlying trends continue, we think the likelihood of it being a multi-bagger from here isn't high.
One final note, you should learn about the 3 warning signs we've spotted with United Utilities Group (including 2 which don't sit too well with us) .
If you want to search for solid companies with great earnings, check out this free list of companies with good balance sheets and impressive returns on equity.
Have feedback on this article? Concerned about the content? Get in touch with us directly. Alternatively, email editorial-team (at) simplywallst.com.
This article by Simply Wall St is general in nature. We provide commentary based on historical data and analyst forecasts only using an unbiased methodology and our articles are not intended to be financial advice. It does not constitute a recommendation to buy or sell any stock, and does not take account of your objectives, or your financial situation. We aim to bring you long-term focused analysis driven by fundamental data. Note that our analysis may not factor in the latest price-sensitive company announcements or qualitative material. Simply Wall St has no position in any stocks mentioned.
