
 Yahoo Finance
 Is United Utilities Group PLC (LON:UU.) A Financially Sound Company?

Small-caps and large-caps are wildly popular among investors, however, mid-cap stocks, such as United Utilities Group PLC (LSE:UU.), with a market capitalization of UK£5.35B, rarely draw their attention from the investing community. Despite this, the two other categories have lagged behind the risk-adjusted returns of commonly ignored mid-cap stocks. UU.’s financial liquidity and debt position will be analysed in this article, to get an idea of whether the company can fund opportunities for strategic growth and maintain strength through economic downturns. Don’t forget that this is a general and concentrated examination of Amazon’s financial health, so you should conduct further analysis into UU. here. See our latest analysis for United Utilities Group
How does UU.’s operating cash flow stack up against its debt?
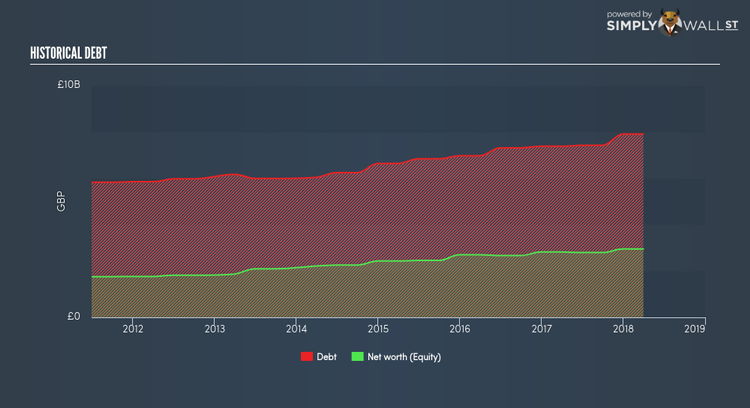
UU.’s debt levels surged from UK£7.38B to UK£7.91B over the last 12 months , which comprises of short- and long-term debt. With this growth in debt, UU. currently has UK£510.00M remaining in cash and short-term investments for investing into the business. Moreover, UU. has generated UK£815.60M in operating cash flow over the same time period, resulting in an operating cash to total debt ratio of 10.31%, signalling that UU.’s debt is not appropriately covered by operating cash. This ratio can also be interpreted as a measure of efficiency as an alternative to return on assets. In UU.’s case, it is able to generate 0.1x cash from its debt capital.
Can UU. pay its short-term liabilities?
With current liabilities at UK£1.14B, it appears that the company has been able to meet these obligations given the level of current assets of UK£1.15B, with a current ratio of 1.01x. For Water Utilities companies, this ratio is within a sensible range since there is a bit of a cash buffer without leaving too much capital in a low-return environment.
Does UU. face the risk of succumbing to its debt-load?
With total debt exceeding equities, UU. is considered a highly levered company. This is not uncommon for a mid-cap company given that debt tends to be lower-cost and at times, more accessible. We can test if UU.’s debt levels are sustainable by measuring interest payments against earnings of a company. Ideally, earnings before interest and tax (EBIT) should cover net interest by at least three times. For UU., the ratio of 2.54x suggests that interest is not strongly covered, which means that lenders may be more reluctant to lend out more funding as UU.’s low interest coverage already puts the company at higher risk of default.
Next Steps:
At its current level of cash flow coverage, UU. has room for improvement to better cushion for events which may require debt repayment. However, the company will be able to pay all of its upcoming liabilities from its current short-term assets. I admit this is a fairly basic analysis for UU.’s financial health. Other important fundamentals need to be considered alongside. I recommend you continue to research United Utilities Group to get a better picture of the stock by looking at:
Future Outlook: What are well-informed industry analysts predicting for UU.’s future growth? Take a look at our free research report of analyst consensus for UU.’s outlook.
Valuation: What is UU. worth today? Is the stock undervalued, even when its growth outlook is factored into its intrinsic value? The intrinsic value infographic in our free research report helps visualize whether UU. is currently mispriced by the market.
Other High-Performing Stocks: Are there other stocks that provide better prospects with proven track records? Explore our free list of these great stocks here.
To help readers see pass the short term volatility of the financial market, we aim to bring you a long-term focused research analysis purely driven by fundamental data. Note that our analysis does not factor in the latest price sensitive company announcements.
The author is an independent contributor and at the time of publication had no position in the stocks mentioned.
