
 Yahoo Finance
 Universal Music Group (AMS:UMG) Is Aiming To Keep Up Its Impressive Returns
If you're not sure where to start when looking for the next multi-bagger, there are a few key trends you should keep an eye out for. Ideally, a business will show two trends; firstly a growing return on capital employed (ROCE) and secondly, an increasing amount of capital employed. Ultimately, this demonstrates that it's a business that is reinvesting profits at increasing rates of return. So, when we ran our eye over Universal Music Group's (AMS:UMG) trend of ROCE, we really liked what we saw.
Return On Capital Employed (ROCE): What Is It?
For those that aren't sure what ROCE is, it measures the amount of pre-tax profits a company can generate from the capital employed in its business. The formula for this calculation on Universal Music Group is:
Return on Capital Employed = Earnings Before Interest and Tax (EBIT) ÷ (Total Assets - Current Liabilities)
0.21 = €1.4b ÷ (€13b - €6.3b) (Based on the trailing twelve months to December 2023).
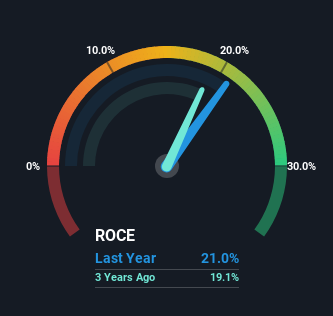
Thus, Universal Music Group has an ROCE of 21%. In absolute terms that's a great return and it's even better than the Entertainment industry average of 11%.
Check out our latest analysis for Universal Music Group
Above you can see how the current ROCE for Universal Music Group compares to its prior returns on capital, but there's only so much you can tell from the past. If you're interested, you can view the analysts predictions in our free analyst report for Universal Music Group .
What Does the ROCE Trend For Universal Music Group Tell Us?
It's hard not to be impressed by Universal Music Group's returns on capital. Over the past four years, ROCE has remained relatively flat at around 21% and the business has deployed 45% more capital into its operations. With returns that high, it's great that the business can continually reinvest its money at such appealing rates of return. You'll see this when looking at well operated businesses or favorable business models.
On a separate but related note, it's important to know that Universal Music Group has a current liabilities to total assets ratio of 48%, which we'd consider pretty high. This can bring about some risks because the company is basically operating with a rather large reliance on its suppliers or other sorts of short-term creditors. Ideally we'd like to see this reduce as that would mean fewer obligations bearing risks.
Our Take On Universal Music Group's ROCE
Universal Music Group has demonstrated its proficiency by generating high returns on increasing amounts of capital employed, which we're thrilled about. Therefore it's no surprise that shareholders have earned a respectable 33% return if they held over the last year. So while the positive underlying trends may be accounted for by investors, we still think this stock is worth looking into further.
If you'd like to know about the risks facing Universal Music Group, we've discovered 1 warning sign that you should be aware of.
If you'd like to see other companies earning high returns, check out our free list of companies earning high returns with solid balance sheets here.
Have feedback on this article? Concerned about the content? Get in touch with us directly. Alternatively, email editorial-team (at) simplywallst.com.
This article by Simply Wall St is general in nature. We provide commentary based on historical data and analyst forecasts only using an unbiased methodology and our articles are not intended to be financial advice. It does not constitute a recommendation to buy or sell any stock, and does not take account of your objectives, or your financial situation. We aim to bring you long-term focused analysis driven by fundamental data. Note that our analysis may not factor in the latest price-sensitive company announcements or qualitative material. Simply Wall St has no position in any stocks mentioned.
