
 Yahoo Finance
 USD/CAD – Canadian Dollar Hits 1-Mth High
The Canadian dollar is steady on Thursday, after posting sharp gains on Wednesday. Currently, USD/CAD is trading at 1.3182, down 0.08% on the day. On the fundamental front, Canada’s trade deficit was up slightly, from C$1.0 billion to C$1.1 billion. This beat the forecast of C$1.4 billion. There was better news from Ivey PMI, which jumped to 60.0, crushing the estimate of 49.3 pts.
Higher Oil Prices Boost Canadian Dollar
Higher oil prices on Wednesday helped boost the Canadian dollar, which posted its highest one-day gains since early September. Crude jumped 3.6%, after a crude inventory report showed a decline of 4.9 billion barrels, compared to the estimate of 1.6 million. Crude prices were also supported ahead of a key OPEC meeting, where Saudi Arabia is expected to push hard for another reduction in oil production, in order to prevent oil prices from falling sharply. With a large glut of oil on global markets, oil prices could fall as low as $40 a barrel if production is not reduced.
On Wednesday, the Bank of Canada maintained the benchmark rate at 1.75% at its monthly policy meeting. The rate statement was positive, which helped boost the Canadian dollar. The bank said that there was “nascent evidence that the global economy is stabilizing” and that recession concerns had eased.
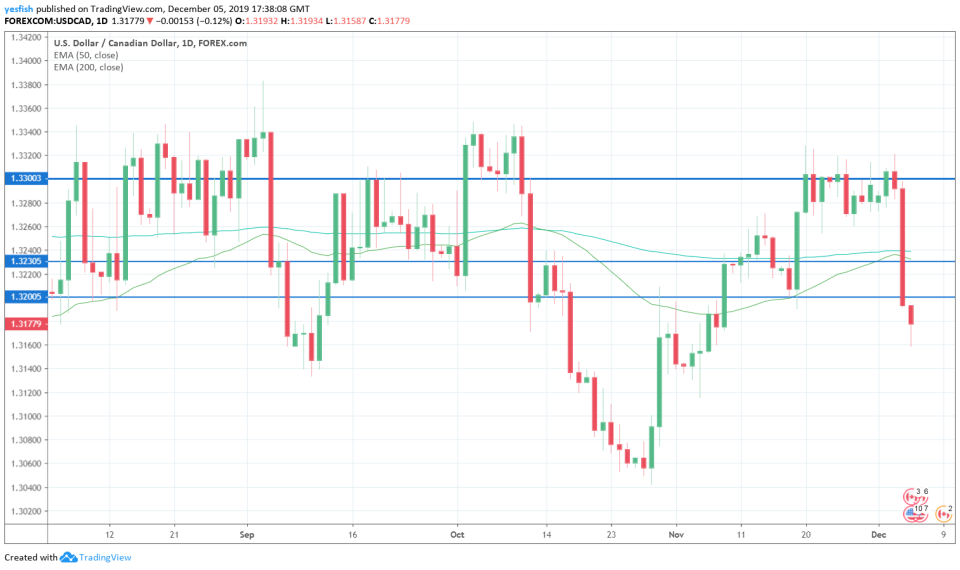
Technical Analysis
USD/CAD has broken below support at the 1.3230 line and is putting strong pressure on the 1.3200 line. On the upside, the 50-EMA and 200-EMA are both touching the candlesticks. The 50-EMA is at 1.3236 and the 200-EMA is at 1.3239. If the 50-EMA crosses over the 200-EMA, this would be a bullish sign for the pair (“golden cross”). Above, the resistance line of 1.3300 has some breathing room after losses by USD/CAD.
EUR/GBP
EUR/GBP has posted slight losses on Thursday. Currently, the pair is trading at 0.8442, down 0.14% on the day.

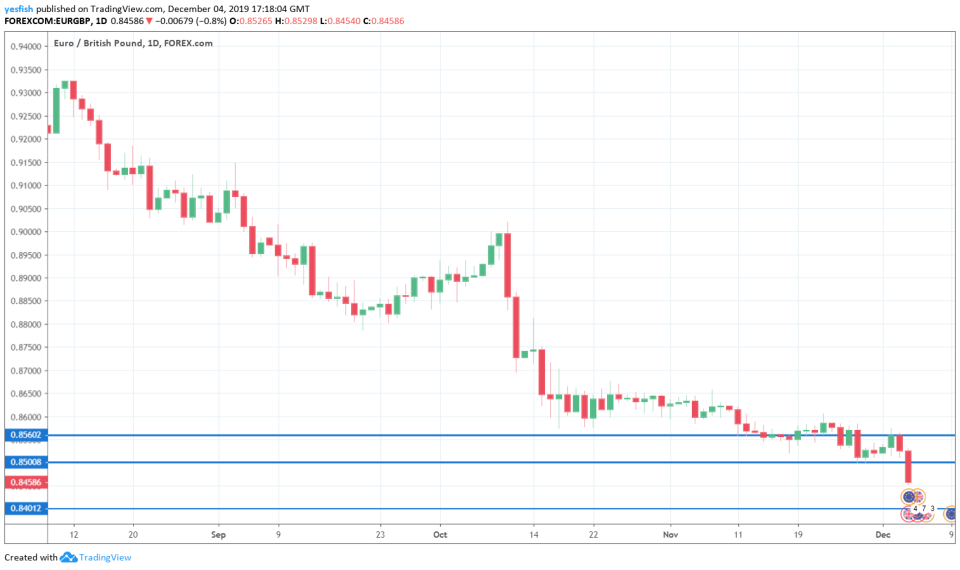
Technical Analysis
The downward trend continues for EUR/GBP. The pair has broken below major support at 0.8500 and has room to drop all the way to 0.8400, which is the next support level. On the upside, the line of 0.8560 has strengthened in resistance, following sharp losses by EUR/GBP on Wednesday.
This article was originally posted on FX Empire
