
 Yahoo Finance
 USD/CAD Daily Forecast – Key Focus over Escalating US-Sino Trade Tensions
During the early hours, the Loonie pair had already shifted gears, shooting up from 1.3192 bottom mark to 1.3243 level. Laterwards, the pair appeared to slow down, maintaining a consolidation near 1.3226 level.
Meantime, the Crude prices had appeared to drop since last Friday as the US imposed an additional tariff duty over the $300 billion Chinese goods. Anyhow, now Trump’s tariffs have covered nearly all the imported Chinese products. And, the commodity prices continued to tumble as China had recently initiated some retaliation over the US counterpart. Beijing has allowed the Yuan to slip to almost a decade low against the dollar. Along with that, China has asked the state-owned companies to suspend the imports of US agricultural products.

On the technical side, the Crude Oil WTI Futures was forming a symmetrical triangle since April 23. However, today, the Crude Futures was struggling to breach and move above the significant SMAs in order to justify the symmetrical triangle.
Significant Economic Events
The most crucial US ISM July Non-Manufacturing PMI data release would happen at around 14:00 GMT. This time, the street analysts hope the Non-Manufacturing PMI to grow 0.73% over the previous 55.1 points. Anyhow, the market holds an in-line estimation over the July Markit Services and Composite PMI data releases.
Notably, the Treasury Bill Yield figures would come out following the PMI data. Last time, the 3-month yield had reported 2.07% while the 6-month yield had stalled near 2.035%.
Today, the Canadian economic calendar stays light-weighed amid lack of CAD-specific and Oil catalyst events like API/EIA Crude data reports.
Technical Analysis
1-Month Chart
Bulls might overtake the bears in the long run. On the monthly chart, a stable 6-year old slanting ascending support line ensured to limit the downside losses.

Notably, the 50-day short term SMA had already crossed and shifted above the other long term SMAs. Such a movement marks for a “Golden Cross”, encouraging the bulls. However, while moving to the north-side, the pair might find uneasiness near 1.3503, 1.3697, and 1.403 resistances.
1-Week Chart
The USD/CAD pair was drifting between the 2:1 and 3:1 Gann lines, sustaining positive price actions. Meanwhile, the Relative Strength Index (RSI) was heading north, indicating 51.2 neutral levels.
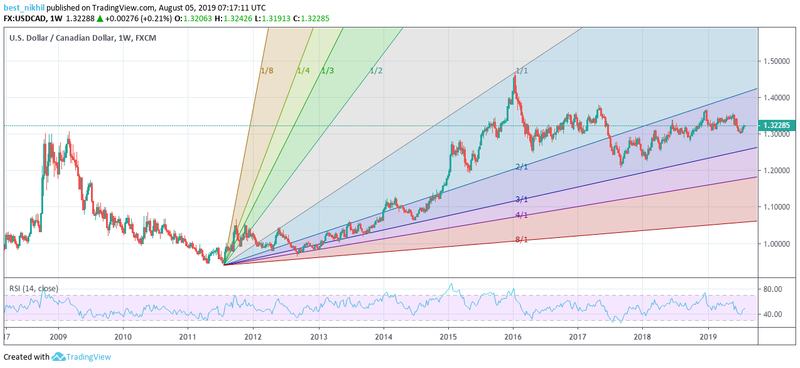
Any upward movement, allowing the pair to march above the 1.3500 psychological mark would shift the next target towards 1.3672 level.
1-Day Chart
On the daily chart, the Loonie pair was making upside moves, aiming the overhead Red Ichimoku Clouds.
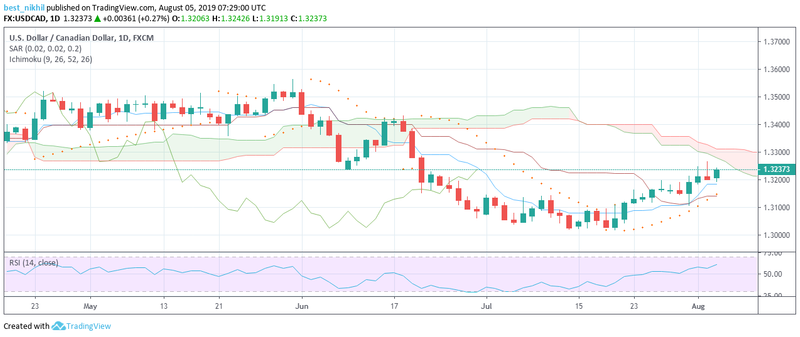
Also, the Parabolic SAR was approaching the trading pair from the bottom, signaling a trend reversal. Even the USD/CAD pair was trading well above the base line and the conversion line, strengthening the bulls.
This article was originally posted on FX Empire
More From FXEMPIRE:
Gold Price Futures (GC) Technical Analysis – August 5, 2019 Forecast
AUD/USD and NZD/USD Fundamental Weekly Forecast – RBA May Pass on Rate Cut, RBNZ Will Cut
E-mini NASDAQ-100 Index (NQ) Futures Technical Analysis – August 5, 2019
EUR/USD Daily Forecast – Critical Resistance Fails to Block Recovery
