
 Yahoo Finance
 USD/CAD Daily Forecast – Overbought RSI Playing its Role, Pleasing Bears
After touching the 1.3256 top mark yesterday, the bulls appeared to lose hold of the accumulated gains gradually. The Loonie pair had made the opening near 1.3311 level on Thursday and was heading south side laterwards. On moving further down, the USD/CAD pair might encounter the 1.3291 resistance-turned-support handle.
DXY Struggling to Maintain Uptrend
After taking a bounce off from the 2:1 Gann line earlier this month, the USD Index was underway to sustain a strong positive trend.
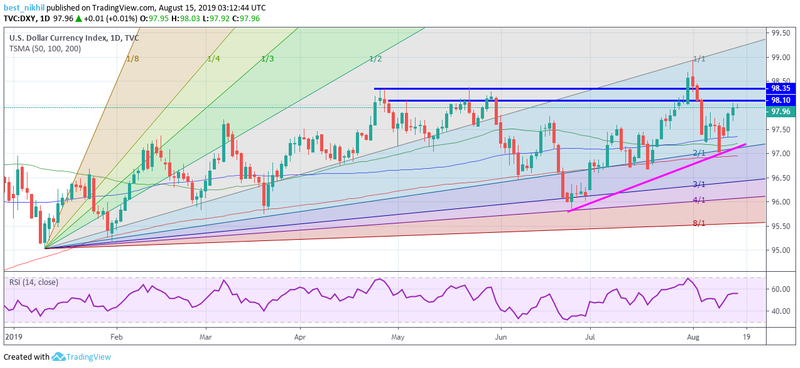
Notably, the downside remained entirely cemented with stable SMA conflux made up of 50-day, 100-day, and 200-day SMA. However, the RSI continued to remain muted near 56 mark since the last two sessions. Any immediate price action to the upside would activate the resistances stalled at 98.10 and 98.35 levels.
Significant Economic Events
The US Retail Sales release and Jobless Claim reports would remain under the focus light for Thursday. The market seems to remain quite bearish over the highly volatile July Retail Sales Control Group, expecting 0.3% over the previous 0.7%. Jobless Claim reports would remain as another point of interest for traders today, keeping a bearish perspective this time. Quite notably, the street analysts expect the Continuing Jobless Claim computed since August 2 to record 1.690 million over the prior 1.684 million.
Canadian July ADP Employment Change would come at around 12:30 GMT along with the release of the USD-specific events. This ADP data had recorded 30.4K last time.
Today, the economic docket lacks substantial oil-impacting Crude reports like the EIA/API which might have attempted to tweak Crude daily price actions.
Technical Analysis
1-Day Chart
Bulls appeared to stay in the lead on the daily chart. The USD/CAD pair had already breached above the Red Ichimoku Clouds, sustaining a positive outlook.
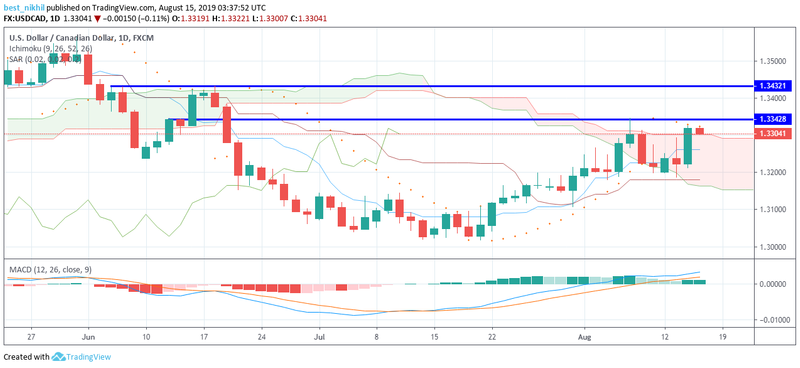
Also, the below-lying base line and the conversion line provided the additional ammunition to the pair bulls. A triumphant march above 1.3321 mark might immediately enable fresh challenges on 1.3343 and 1.3432 resistances. Meantime, the MACD line and the signal line of the MACD technical indicator pointed to the north, staying above the zero line. Nevertheless, the Parabolic SAR was hovering above the trading pair, signaling rising bear strength.
3-Hour Chart
Since the last North American session, the overbought RSI was steadily playing its role in bringing down the pair.

Though the pair was trading inside the upper vicinity of the Bollinger Bands, the pair was heading south after testing 1.3328 resistance. With an assumption of near-term weakness in the pair, the next targets would remain at 1.3290, 1.3213, and 1.3186 support levels. Anyhow, a breach above the 1.3328 resistance might activate 1.3345 highest mark as an immediate target on the upside.
This article was originally posted on FX Empire