
 Yahoo Finance
 USD/JPY Forex Technical Analysis – Closing Price Reversal Top Confirmed with 110.596 – 110.246 Next Target
The Dollar/Yen is trading flat early Friday after posting a potentially bearish closing price reversal top the previous session. The chart pattern doesn’t indicate an impending change in trend, but if confirmed, it could trigger the start of a 2 to 3 day correction. Basically, it is a sign that the selling is greater than the buying at current price levels, which usually means traders are taking profits after a solid rally.
At 03:47 GMT, the USD/JPY is trading 111.240, down 0.040 or -0.04%.
The USD/JPY edged lower from a multi-month high on Thursday, pressured a little by a rise in U.S. weekly jobless claims, with investors also booking profits after a steep rise the last few sessions.
The Dollar/Yen overall has been supported by the spike in U.S. Treasury yields amid expectations the Federal Reserve will taper its monetary stimulus beginning in November even as global growth slows.
Daily Swing Chart Technical Analysis
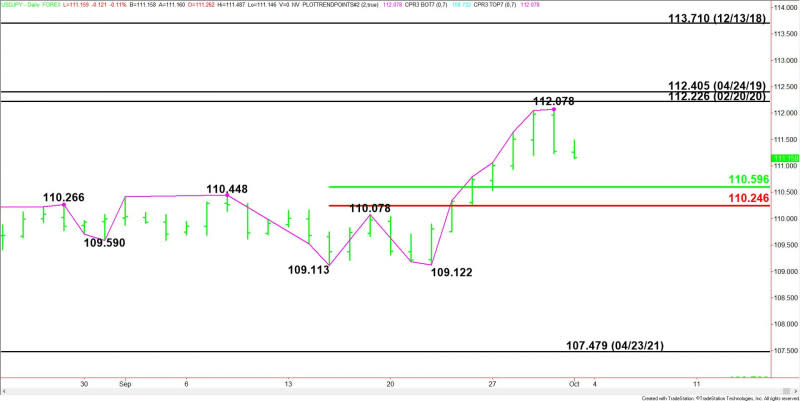
The main trend is up according to the daily swing chart, but momentum has shifted to the downside with the confirmation of Thursday’s closing price reversal top.
A trade through 112.078 will negate the closing price reversal top and signal a resumption of the uptrend. The main trend will change to down on a trade through 109.122.
The minor range is 109.113 to 112.078. Its retracement zone at 110.596 to 110.246 is the first downside target area.
Daily Swing Chart Technical Forecast
The direction of the USD/JPY on Friday is likely to be determined by trader reaction to 111.660.
Bearish Scenario
A sustained move under 111.660 will indicate the presence of sellers. Taking out 111.241 will confirm the closing price reversal top. This could trigger the start of a 2 to 3 day correction with 110.596 to 110.246 the next potential downside target. Since the main trend is up, look for buyers on the first test of this area.
Bullish Scenario
A sustained move over 111.660 will signal the presence of buyers. If this creates enough upside momentum then look for the rally to possibly extend into 112.078, followed by main tops at 112.226 and 112.405. The latter is a potential trigger point for an acceleration to the upside.
For a look at all of today’s economic events, check out our economic calendar.
This article was originally posted on FX Empire
