
 Yahoo Finance
 USDCNH with a negative sentiment
Since the middle of September to the 22nd of November, the USDCNH was in the symmetric triangle pattern, which was created after the heavy drop that occurred here since the beginning of the year. The volatility was decreasing with every week and we were waiting for a breakout from this tight range. On the 22nd the price decided to break the lower line of the triangle, which resulted in a mid-term sell signal.
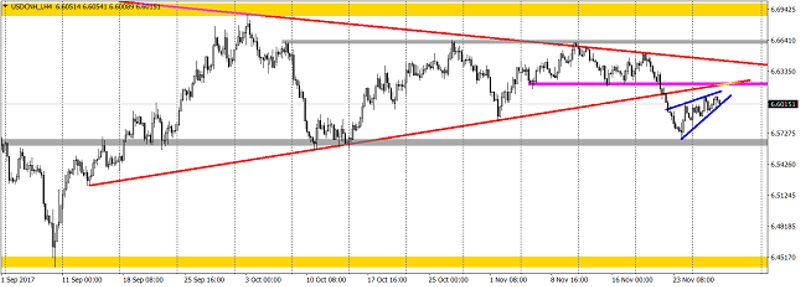
After the breakout, the price went firmly lower and checked in on the important horizontal support on the 6.56 (lower grey area). That is where traders decided to take first profits from the downswing. Current upswing which we can observe on the chart is the wedge pattern (blue lines) so a trend continuation pattern, indicating that the recent rise is in fact just a small bounce, not a proper reversal.
Sentiment on this pair stays negative as we still have important three resistances ahead of us. First one is an upper line of the wedge, the second one is the horizontal resistance on the 6.62 and the third one is the lower line of the triangle. As long, as we stay below those three, sellers have a bigger chance for a success. The closest target for the price is the grey area tested on the 24th of November.
This article is written by Tomasz Wisniewski, a senior analyst at Alpari Research & Analysis
This article was originally posted on FX Empire
