
 Yahoo Finance
 V.S. Industry Berhad (KLSE:VS) May Have Issues Allocating Its Capital
What trends should we look for it we want to identify stocks that can multiply in value over the long term? Typically, we'll want to notice a trend of growing return on capital employed (ROCE) and alongside that, an expanding base of capital employed. Put simply, these types of businesses are compounding machines, meaning they are continually reinvesting their earnings at ever-higher rates of return. However, after investigating V.S. Industry Berhad (KLSE:VS), we don't think it's current trends fit the mold of a multi-bagger.
What Is Return On Capital Employed (ROCE)?
For those who don't know, ROCE is a measure of a company's yearly pre-tax profit (its return), relative to the capital employed in the business. To calculate this metric for V.S. Industry Berhad, this is the formula:
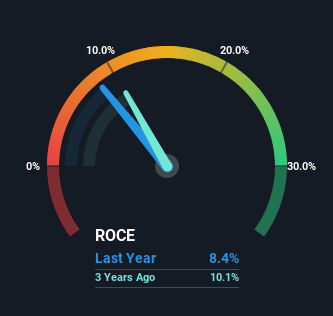
Return on Capital Employed = Earnings Before Interest and Tax (EBIT) ÷ (Total Assets - Current Liabilities)
0.084 = RM254m ÷ (RM4.1b - RM1.1b) (Based on the trailing twelve months to October 2023).
Therefore, V.S. Industry Berhad has an ROCE of 8.4%. Ultimately, that's a low return and it under-performs the Electronic industry average of 11%.
View our latest analysis for V.S. Industry Berhad
In the above chart we have measured V.S. Industry Berhad's prior ROCE against its prior performance, but the future is arguably more important. If you'd like to see what analysts are forecasting going forward, you should check out our free analyst report for V.S. Industry Berhad .
What Does the ROCE Trend For V.S. Industry Berhad Tell Us?
When we looked at the ROCE trend at V.S. Industry Berhad, we didn't gain much confidence. To be more specific, ROCE has fallen from 11% over the last five years. However it looks like V.S. Industry Berhad might be reinvesting for long term growth because while capital employed has increased, the company's sales haven't changed much in the last 12 months. It's worth keeping an eye on the company's earnings from here on to see if these investments do end up contributing to the bottom line.
On a related note, V.S. Industry Berhad has decreased its current liabilities to 27% of total assets. That could partly explain why the ROCE has dropped. Effectively this means their suppliers or short-term creditors are funding less of the business, which reduces some elements of risk. Some would claim this reduces the business' efficiency at generating ROCE since it is now funding more of the operations with its own money.
The Bottom Line
To conclude, we've found that V.S. Industry Berhad is reinvesting in the business, but returns have been falling. Since the stock has gained an impressive 70% over the last five years, investors must think there's better things to come. But if the trajectory of these underlying trends continue, we think the likelihood of it being a multi-bagger from here isn't high.
On a final note, we've found 1 warning sign for V.S. Industry Berhad that we think you should be aware of.
For those who like to invest in solid companies, check out this free list of companies with solid balance sheets and high returns on equity.
Have feedback on this article? Concerned about the content? Get in touch with us directly. Alternatively, email editorial-team (at) simplywallst.com.
This article by Simply Wall St is general in nature. We provide commentary based on historical data and analyst forecasts only using an unbiased methodology and our articles are not intended to be financial advice. It does not constitute a recommendation to buy or sell any stock, and does not take account of your objectives, or your financial situation. We aim to bring you long-term focused analysis driven by fundamental data. Note that our analysis may not factor in the latest price-sensitive company announcements or qualitative material. Simply Wall St has no position in any stocks mentioned.
