
 Yahoo Finance
 Vanguard Perspective: Is There (N)Ever a Good Time for Active?
I have been in the investment profession for a number of years now. Over those years, I feel like I've experienced a cyclically recurring claim that has emerged once again: Now is a good time for active management. Every time I hear that, I wonder why any time wouldor would notbe a good time for active management.
I wonder because I'm less clear why time as a function of a particular day, month, or year would necessarily matter. It is clearer to me that time as a function of market conditions would matter. Historically, volatility and dispersion have been key market conditions because each represents opportunity for active fund managers.
Volatility is the variability of the market's return. It represents the opportunity for market timing. Active managers could seek to add value by trying to take advantage of the market's ups and downs. Of course, trying to time the market is risky.
Dispersion is the variability of individual stocks' returns around the market's return. It represents the opportunity for stock selection. Active managers could seek to add value by trying to pick outperforming stocks. However, this comes with the risk of picking underperforming ones.
We analyzed the performance of active U.S. equity funds during periods characterized by volatility and dispersion over 20-plus years to see whether either of these conditions has fostered a good time for active.
If either market condition has been good for active, we would expect to see general relationships. For example, if increased market timing opportunity benefited performance, then excess return should rise as volatility goes up (moving from the first column to the fifth column in the chart that follows). Likewise, if increased stock selection opportunity benefited performance, then excess return should rise as dispersion goes up (moving from the chart's first row to the fifth row).
But the chart shows there does not seem to be a particular relationship between average excess return and volatility or dispersion. Nor does it seem to be the case that excess return consistently decreases.
Investors who want to try to outperform a benchmark can still focus on partnering with a manager in whom they have strong conviction. But at least when viewing time as a function of market conditions, such as volatility and dispersion, there does not seem to be a consistently good or bad time for active in the aggregate.
Excess returns don't seem related to volatility or dispersion
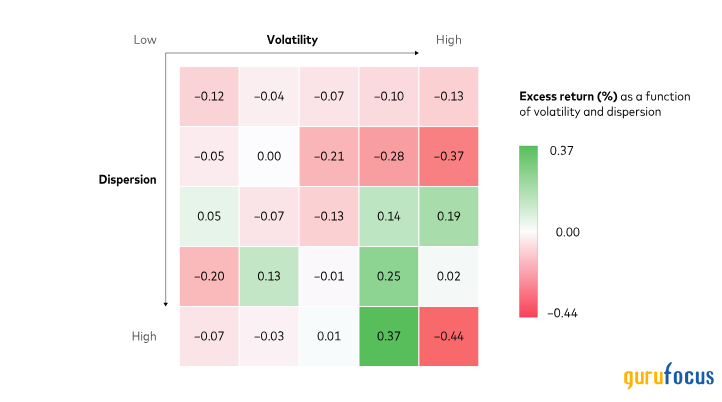
Notes: The chart shows the average performance of U.S. active equity funds corresponding to a double sort of monthly volatility and dispersion. Volatility is ranked from low to high and sorted into equal-sized quintiles; within each volatility quintile, dispersion is ranked from low to high and sorted into equal-sized quintiles. Volatility is represented by the variance of the Russell 3000 Index's daily total returns in a month. Dispersion is defined as the market-capitalization-weighted cross-sectional variance of Russell 3000 Index constituent total returns in a month. U.S. active equity funds includes U.S. domiciled open-end active funds in the U.S. category group U.S. equity that have ever existed (that is, U.S. active style box funds). The performance indicated in each cell is the corresponding mean monthly excess return relative to a representative Morningstar style-box benchmark for all fund observations occurring in the months contained in a given cell. Performance is based on monthly fund net returns from January 2000 through December 2023. Past performance is no guarantee of future returns. The performance of an index is not an exact representation of any particular investment, as you cannot invest directly in an index.
Source: Vanguard calculations, using data from Morningstar, Inc., and FactSet.
Special thanks to Jane Wang, Vanguard Investment Strategy Analyst, for her contributions to this article.
Notes:
All investing is subject to risk, including the possible loss of the money you invest. Diversification does not ensure a profit or protect against a loss.
CFA is a registered trademark owned by CFA Institute.
This article first appeared on GuruFocus.
