
 Yahoo Finance
 Vector Limited (NZSE:VCT) Delivered A Weaker ROE Than Its Industry

Many investors are still learning about the various metrics that can be useful when analysing a stock. This article is for those who would like to learn about Return On Equity (ROE). By way of learning-by-doing, we'll look at ROE to gain a better understanding of Vector Limited (NZSE:VCT).
Return on Equity or ROE is a test of how effectively a company is growing its value and managing investors’ money. In other words, it is a profitability ratio which measures the rate of return on the capital provided by the company's shareholders.
Check out our latest analysis for Vector
How To Calculate Return On Equity?
ROE can be calculated by using the formula:
Return on Equity = Net Profit (from continuing operations) ÷ Shareholders' Equity
So, based on the above formula, the ROE for Vector is:
4.3% = NZ$97m ÷ NZ$2.3b (Based on the trailing twelve months to June 2020).
The 'return' is the income the business earned over the last year. One way to conceptualize this is that for each NZ$1 of shareholders' capital it has, the company made NZ$0.04 in profit.
Does Vector Have A Good Return On Equity?
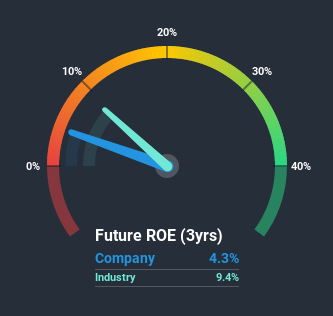
Arguably the easiest way to assess company's ROE is to compare it with the average in its industry. Importantly, this is far from a perfect measure, because companies differ significantly within the same industry classification. As is clear from the image below, Vector has a lower ROE than the average (9.4%) in the Integrated Utilities industry.
That certainly isn't ideal. However, a low ROE is not always bad. If the company's debt levels are moderate to low, then there's still a chance that returns can be improved via the use of financial leverage. A company with high debt levels and low ROE is a combination we like to avoid given the risk involved. You can see the 2 risks we have identified for Vector by visiting our risks dashboard for free on our platform here.
The Importance Of Debt To Return On Equity
Most companies need money -- from somewhere -- to grow their profits. The cash for investment can come from prior year profits (retained earnings), issuing new shares, or borrowing. In the first and second cases, the ROE will reflect this use of cash for investment in the business. In the latter case, the debt used for growth will improve returns, but won't affect the total equity. That will make the ROE look better than if no debt was used.
Combining Vector's Debt And Its 4.3% Return On Equity
Vector does use a high amount of debt to increase returns. It has a debt to equity ratio of 1.39. The combination of a rather low ROE and significant use of debt is not particularly appealing. Debt increases risk and reduces options for the company in the future, so you generally want to see some good returns from using it.
Summary
Return on equity is useful for comparing the quality of different businesses. In our books, the highest quality companies have high return on equity, despite low debt. If two companies have the same ROE, then I would generally prefer the one with less debt.
Having said that, while ROE is a useful indicator of business quality, you'll have to look at a whole range of factors to determine the right price to buy a stock. The rate at which profits are likely to grow, relative to the expectations of profit growth reflected in the current price, must be considered, too. So I think it may be worth checking this free report on analyst forecasts for the company.
If you would prefer check out another company -- one with potentially superior financials -- then do not miss this free list of interesting companies, that have HIGH return on equity and low debt.
This article by Simply Wall St is general in nature. It does not constitute a recommendation to buy or sell any stock, and does not take account of your objectives, or your financial situation. We aim to bring you long-term focused analysis driven by fundamental data. Note that our analysis may not factor in the latest price-sensitive company announcements or qualitative material. Simply Wall St has no position in any stocks mentioned.
Have feedback on this article? Concerned about the content? Get in touch with us directly. Alternatively, email editorial-team@simplywallst.com.
