
 Yahoo Finance
 Verisk (VRSK) Q2 Earnings Miss Estimates, Revenues Beat
Verisk Analytics VRSK reported mixed second-quarter 2019 results, wherein the company’s earnings lagged the Zacks Consensus Estimate but revenues surpassed the same.
Adjusted earnings per share of $1.10 missed the consensus mark by a penny but improved 4.8% on a year-over-year basis. The company’s bottom line benefited from organic growth, contributions from acquisitions, decrease in interest expense and lower average share count, which were partially offset by the timing of the incremental stock-based compensation, rise in depreciation and amortization expense, and a higher effective tax rate.
Revenues of $652.6 million beat the consensus estimate by $7.6 million and improved 8.5% year over year on a reported basis and 7.2% on an organic constant-currency (cc) basis.
So far this year, shares of Verisk have gained 39.4%, outperforming 38% rise of the industry it belongs to and 19.1% increase of the Zacks S&P 500 composite.

Let’s check out the numbers in detail.
Segmental Performance
Insurance segment revenues totaled $468.5 million, up 9.1% year over year on a reported basis and 7.8% in organic cc.
Within the segment, underwriting and rating revenues of $312.3 million rose 8.1% on a reported basis and 7.1% in organic cc. The improvement was primarily driven by increases in industry-standard insurance programs, property-specific underwriting and catastrophe modeling solutions revenues. Claims revenues amounted to $156.2 million, which improved 11.2% on a reported basis and 9% in organic cc. The uptick can be attributed to revenues from repair cost estimating, claims analytics and remote imagery solutions.
Energy and Specialized Markets segment revenues amounted to $139.8 million and improved 7.6% year over year on a reported basis and 5.5% in organic cc. The improvement can also be attributed to revenues from market and cost intelligence solutions and core research.
Financial Services segment revenues of $44.3 million improved 5.5% year over year on a reported basis and 6.1% in organic cc. Strength in spend-informed analytics solutions and portfolio management boosted the segment.
Verisk Analytics, Inc. Revenue (TTM)
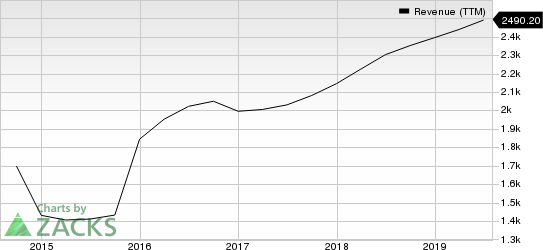
Verisk Analytics, Inc. revenue-ttm | Verisk Analytics, Inc. Quote
Operating Results
Adjusted EBITDA of $304.1 million increased 5.7% on a reported basis and 5.2% in organic cc. Adjusted EBITDA margin was 46.6% compared with 47.8% in the prior-year quarter.
Verisk Analytics, Inc. Price, Consensus and EPS Surprise
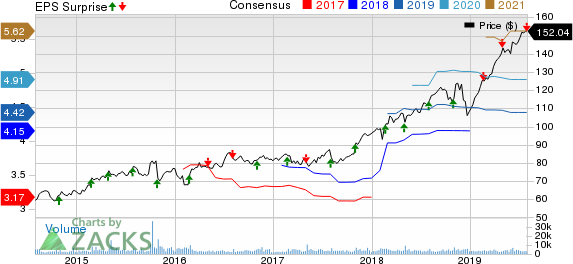
Verisk Analytics, Inc. price-consensus-eps-surprise-chart | Verisk Analytics, Inc. Quote
Adjusted EBITDA expenses (cost of revenues; selling, general and administrative expenses; investment income and others) increased 11.1% to $348.5 million.
Operating income in the second quarter was $218.3 million compared with $212.3 million in the prior-year quarter. Operating margin was 33.5% compared with 35.3% in the year-ago quarter.
Balance Sheet and Cash Flow
Verisk exited second-quarter 2019 with cash and cash equivalents of $153.3 million compared with $179.5 million at the end of the prior quarter. Long-term debt came in at $2.45 billion compared with $2.44 billion at the end of the previous quarter.
The company generated $200.3 million of cash from operating activities and spent $46.9 million on capex. Free cash flow was $153.4 million.
Share Repurchases & Dividend Payout
During the second quarter of 2019, through an accelerated share repurchase (ASR) agreement, Verisk repurchased roughly 361,000 shares at an average price of $138.32 for a total cost of $50 million. The company also entered into an additional $75 million ASR agreement. The associated shares will be delivered and settled in the third quarter of 2019. As of Jun 30, 2019, the company had $303 million under its share repurchase authorization.
The company paid out a cash dividend of 25 cents per share on Jun 28. On Jul 24, the company's board of directors approved a cash dividend of 25 cents per share to be paid out on Sep 30 to shareholders of record as of Sep 13.
Zacks Rank & Upcoming Releases
Currently, Verisk carries a Zacks Rank #3 (Hold). You can see the complete list of today’s Zacks #1 Rank (Strong Buy) stocks here.
Investors interested in the broader Zacks Business Services sector are awaiting second-quarter 2019 earnings of key players like Genpact G, Green Dot GDOT and Navigant Consulting NCI. While Genpact and Green Dot are slated to report on Aug 7, Navigant Consulting is scheduled to release results on Aug 8.
More Stock News: This Is Bigger than the iPhone!
It could become the mother of all technological revolutions. Apple sold a mere 1 billion iPhones in 10 years but a new breakthrough is expected to generate more than 27 billion devices in just 3 years, creating a $1.7 trillion market.
Zacks has just released a Special Report that spotlights this fast-emerging phenomenon and 6 tickers for taking advantage of it. If you don't buy now, you may kick yourself in 2020.
Click here for the 6 trades >>
Want the latest recommendations from Zacks Investment Research? Today, you can download 7 Best Stocks for the Next 30 Days. Click to get this free report
Verisk Analytics, Inc. (VRSK) : Free Stock Analysis Report
Navigant Consulting, Inc. (NCI) : Free Stock Analysis Report
Genpact Limited (G) : Free Stock Analysis Report
Green Dot Corporation (GDOT) : Free Stock Analysis Report
To read this article on Zacks.com click here.
Zacks Investment Research
