
 Yahoo Finance
 Is Victrex plc's (LON:VCT) P/E Ratio Really That Good?

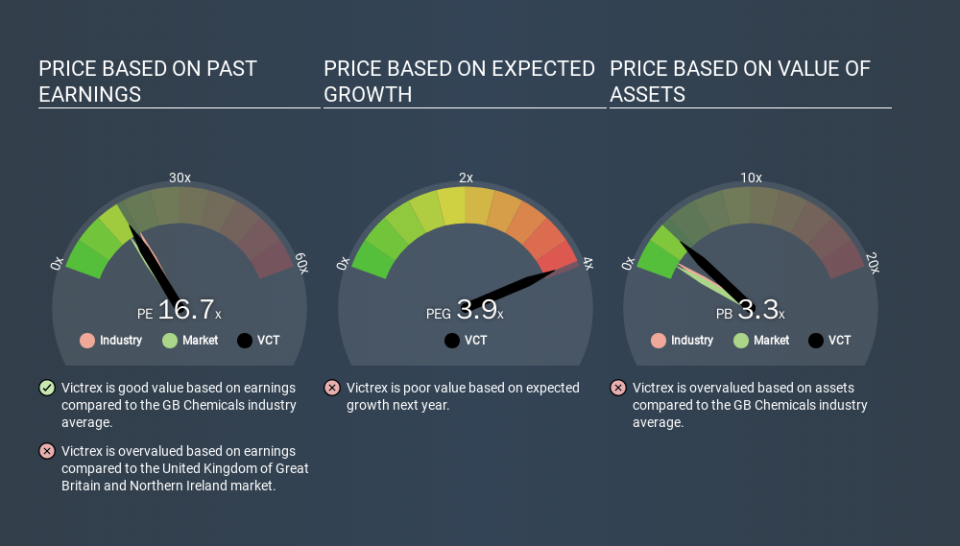
This article is for investors who would like to improve their understanding of price to earnings ratios (P/E ratios). We'll look at Victrex plc's (LON:VCT) P/E ratio and reflect on what it tells us about the company's share price. Looking at earnings over the last twelve months, Victrex has a P/E ratio of 16.65. That corresponds to an earnings yield of approximately 6.0%.
View our latest analysis for Victrex
How Do You Calculate A P/E Ratio?
The formula for P/E is:
Price to Earnings Ratio = Share Price ÷ Earnings per Share (EPS)
Or for Victrex:
P/E of 16.65 = £17.860 ÷ £1.073 (Based on the trailing twelve months to September 2019.)
(Note: the above calculation results may not be precise due to rounding.)
Is A High Price-to-Earnings Ratio Good?
A higher P/E ratio implies that investors pay a higher price for the earning power of the business. That is not a good or a bad thing per se, but a high P/E does imply buyers are optimistic about the future.
How Does Victrex's P/E Ratio Compare To Its Peers?
The P/E ratio essentially measures market expectations of a company. You can see in the image below that the average P/E (16.7) for companies in the chemicals industry is roughly the same as Victrex's P/E.
That indicates that the market expects Victrex will perform roughly in line with other companies in its industry. So if Victrex actually outperforms its peers going forward, that should be a positive for the share price. Further research into factors such as insider buying and selling, could help you form your own view on whether that is likely.
How Growth Rates Impact P/E Ratios
P/E ratios primarily reflect market expectations around earnings growth rates. That's because companies that grow earnings per share quickly will rapidly increase the 'E' in the equation. And in that case, the P/E ratio itself will drop rather quickly. So while a stock may look expensive based on past earnings, it could be cheap based on future earnings.
Victrex shrunk earnings per share by 17% over the last year. But over the longer term (5 years) earnings per share have increased by 2.5%.
Don't Forget: The P/E Does Not Account For Debt or Bank Deposits
The 'Price' in P/E reflects the market capitalization of the company. That means it doesn't take debt or cash into account. In theory, a company can lower its future P/E ratio by using cash or debt to invest in growth.
Such expenditure might be good or bad, in the long term, but the point here is that the balance sheet is not reflected by this ratio.
Is Debt Impacting Victrex's P/E?
Since Victrex holds net cash of UK£73m, it can spend on growth, justifying a higher P/E ratio than otherwise.
The Verdict On Victrex's P/E Ratio
Victrex trades on a P/E ratio of 16.7, which is above its market average of 13.9. The recent drop in earnings per share might keep value investors away, but the net cash position means the company has time to improve: and the high P/E suggests the market thinks it will.
Investors should be looking to buy stocks that the market is wrong about. If the reality for a company is better than it expects, you can make money by buying and holding for the long term. So this free visual report on analyst forecasts could hold the key to an excellent investment decision.
Of course you might be able to find a better stock than Victrex. So you may wish to see this free collection of other companies that have grown earnings strongly.
If you spot an error that warrants correction, please contact the editor at editorial-team@simplywallst.com. This article by Simply Wall St is general in nature. It does not constitute a recommendation to buy or sell any stock, and does not take account of your objectives, or your financial situation. Simply Wall St has no position in the stocks mentioned.
We aim to bring you long-term focused research analysis driven by fundamental data. Note that our analysis may not factor in the latest price-sensitive company announcements or qualitative material. Thank you for reading.
