
 Yahoo Finance
 Is VINCI (EPA:DG) Using Too Much Debt?

Warren Buffett famously said, 'Volatility is far from synonymous with risk.' When we think about how risky a company is, we always like to look at its use of debt, since debt overload can lead to ruin. As with many other companies VINCI SA (EPA:DG) makes use of debt. But is this debt a concern to shareholders?
What Risk Does Debt Bring?
Debt is a tool to help businesses grow, but if a business is incapable of paying off its lenders, then it exists at their mercy. In the worst case scenario, a company can go bankrupt if it cannot pay its creditors. However, a more usual (but still expensive) situation is where a company must dilute shareholders at a cheap share price simply to get debt under control. By replacing dilution, though, debt can be an extremely good tool for businesses that need capital to invest in growth at high rates of return. When we examine debt levels, we first consider both cash and debt levels, together.
Check out our latest analysis for VINCI
What Is VINCI's Debt?
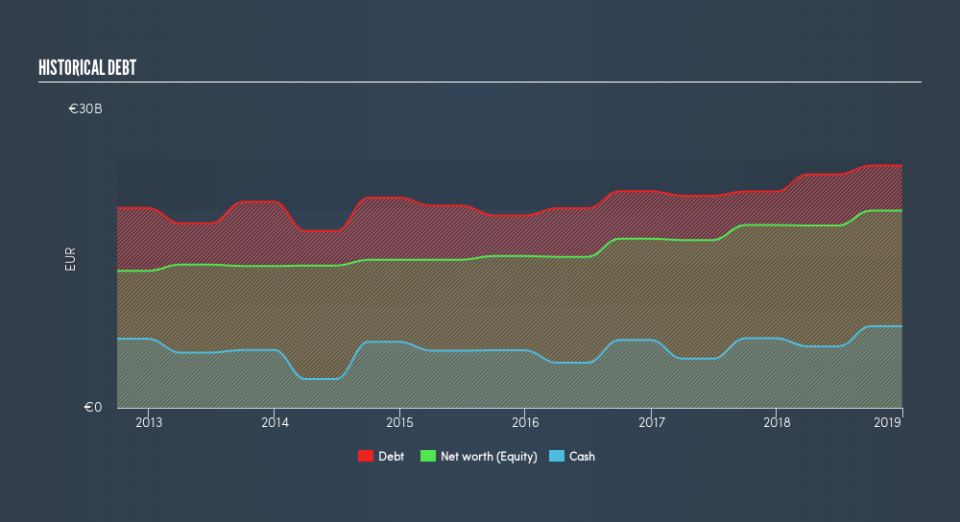
As you can see below, at the end of December 2018, VINCI had €24.5b of debt, up from €21.9b a year ago. Click the image for more detail. However, it does have €8.21b in cash offsetting this, leading to net debt of about €16.3b.
A Look At VINCI's Liabilities
We can see from the most recent balance sheet that VINCI had liabilities of €31.0b falling due within a year, and liabilities of €24.5b due beyond that. Offsetting this, it had €8.21b in cash and €13.9b in receivables that were due within 12 months. So its liabilities total €33.4b more than the combination of its cash and short-term receivables.
This deficit is considerable relative to its very significant market capitalization of €51.7b, so it does suggest shareholders should keep an eye on VINCI's use of debt. This suggests shareholders would heavily diluted if the company needed to shore up its balance sheet in a hurry.
We measure a company's debt load relative to its earnings power by looking at its net debt divided by its earnings before interest, tax, depreciation, and amortization (EBITDA) and by calculating how easily its earnings before interest and tax (EBIT) cover its interest expense (interest cover). This way, we consider both the absolute quantum of the debt, as well as the interest rates paid on it.
VINCI's net debt to EBITDA ratio of about 2.3 suggests only moderate use of debt. And its strong interest cover of 13.6 times, makes us even more comfortable. VINCI grew its EBIT by 8.7% in the last year. That's far from incredible but it is a good thing, when it comes to paying off debt. There's no doubt that we learn most about debt from the balance sheet. But it is future earnings, more than anything, that will determine VINCI's ability to maintain a healthy balance sheet going forward. So if you're focused on the future you can check out this free report showing analyst profit forecasts.
Finally, a company can only pay off debt with cold hard cash, not accounting profits. So it's worth checking how much of that EBIT is backed by free cash flow. During the last three years, VINCI produced sturdy free cash flow equating to 62% of its EBIT, about what we'd expect. This free cash flow puts the company in a good position to pay down debt, when appropriate.
Our View
When it comes to the balance sheet, the standout positive for VINCI was the fact that it seems able to cover its interest expense with its EBIT confidently. But the other factors we noted above weren't so encouraging. For instance it seems like it has to struggle a bit to handle its total liabilities. When we consider all the elements mentioned above, it seems to us that VINCI is managing its debt quite well. But a word of caution: we think debt levels are high enough to justify ongoing monitoring. Over time, share prices tend to follow earnings per share, so if you're interested in VINCI, you may well want to click here to check an interactive graph of its earnings per share history.
If you're interested in investing in businesses that can grow profits without the burden of debt, then check out this free list of growing businesses that have net cash on the balance sheet.
We aim to bring you long-term focused research analysis driven by fundamental data. Note that our analysis may not factor in the latest price-sensitive company announcements or qualitative material.
If you spot an error that warrants correction, please contact the editor at editorial-team@simplywallst.com. This article by Simply Wall St is general in nature. It does not constitute a recommendation to buy or sell any stock, and does not take account of your objectives, or your financial situation. Simply Wall St has no position in the stocks mentioned. Thank you for reading.
