
 Yahoo Finance
 Volatility 101: Should Bayer (ETR:BAYN) Shares Have Dropped 39%?

While it may not be enough for some shareholders, we think it is good to see the Bayer Aktiengesellschaft (ETR:BAYN) share price up 16% in a single quarter. But that doesn't change the fact that the returns over the last five years have been less than pleasing. After all, the share price is down 39% in that time, significantly under-performing the market.
See our latest analysis for Bayer
While markets are a powerful pricing mechanism, share prices reflect investor sentiment, not just underlying business performance. One flawed but reasonable way to assess how sentiment around a company has changed is to compare the earnings per share (EPS) with the share price.
Over five years Bayer's earnings per share dropped significantly, falling to a loss, with the share price also lower. At present it's hard to make valid comparisons between EPS and the share price. But we would generally expect a lower price, given the situation.
The image below shows how EPS has tracked over time (if you click on the image you can see greater detail).
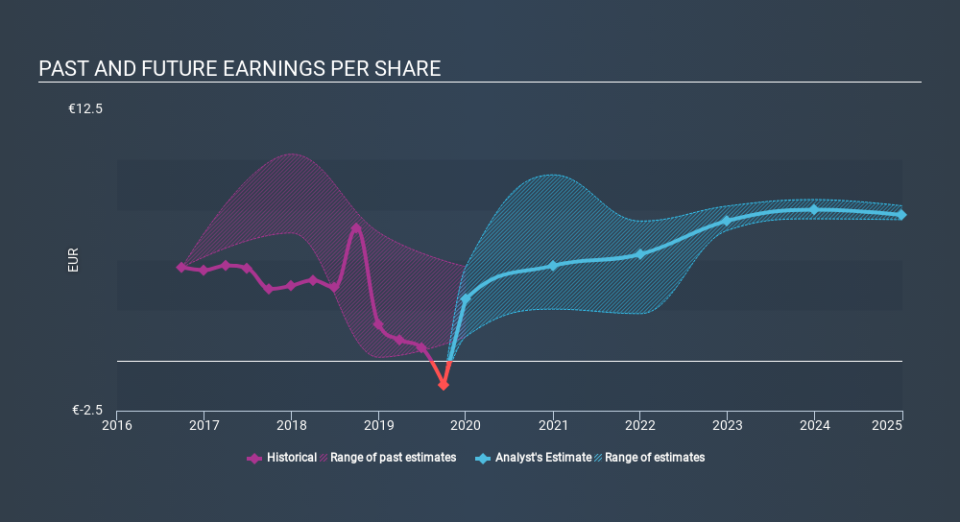
Before buying or selling a stock, we always recommend a close examination of historic growth trends, available here.
What About Dividends?
When looking at investment returns, it is important to consider the difference between total shareholder return (TSR) and share price return. The TSR incorporates the value of any spin-offs or discounted capital raisings, along with any dividends, based on the assumption that the dividends are reinvested. So for companies that pay a generous dividend, the TSR is often a lot higher than the share price return. We note that for Bayer the TSR over the last 5 years was -29%, which is better than the share price return mentioned above. And there's no prize for guessing that the dividend payments largely explain the divergence!
A Different Perspective
Bayer shareholders have received returns of 20% over twelve months (even including dividends) , which isn't far from the general market return. To take a positive view, the gain is pleasing, and it sure beats annualized TSR loss of 6.6%, which was endured over half a decade. While 'turnarounds seldom turn' there are green shoots for Bayer. Keeping this in mind, a solid next step might be to take a look at Bayer's dividend track record. This free interactive graph is a great place to start.
If you would prefer to check out another company -- one with potentially superior financials -- then do not miss this free list of companies that have proven they can grow earnings.
Please note, the market returns quoted in this article reflect the market weighted average returns of stocks that currently trade on DE exchanges.
If you spot an error that warrants correction, please contact the editor at editorial-team@simplywallst.com. This article by Simply Wall St is general in nature. It does not constitute a recommendation to buy or sell any stock, and does not take account of your objectives, or your financial situation. Simply Wall St has no position in the stocks mentioned.
We aim to bring you long-term focused research analysis driven by fundamental data. Note that our analysis may not factor in the latest price-sensitive company announcements or qualitative material. Thank you for reading.
