
 Yahoo Finance
 Volatility 101: Should J Sainsbury (LON:SBRY) Shares Have Dropped 30%?

Investors can approximate the average market return by buying an index fund. But if you buy individual stocks, you can do both better or worse than that. For example, the J Sainsbury plc (LON:SBRY) share price is down 30% in the last year. That's well bellow the market return of 12%. Longer term shareholders haven't suffered as badly, since the stock is down a comparatively less painful 23% in three years. Even worse, it's down 12% in about a month, which isn't fun at all.
View our latest analysis for J Sainsbury
In his essay The Superinvestors of Graham-and-Doddsville Warren Buffett described how share prices do not always rationally reflect the value of a business. By comparing earnings per share (EPS) and share price changes over time, we can get a feel for how investor attitudes to a company have morphed over time.
Unfortunately J Sainsbury reported an EPS drop of 84% for the last year. The share price fall of 30% isn't as bad as the reduction in earnings per share. It may have been that the weak EPS was not as bad as some had feared. With a P/E ratio of 113.56, it's fair to say the market sees an EPS rebound on the cards.
The image below shows how EPS has tracked over time (if you click on the image you can see greater detail).
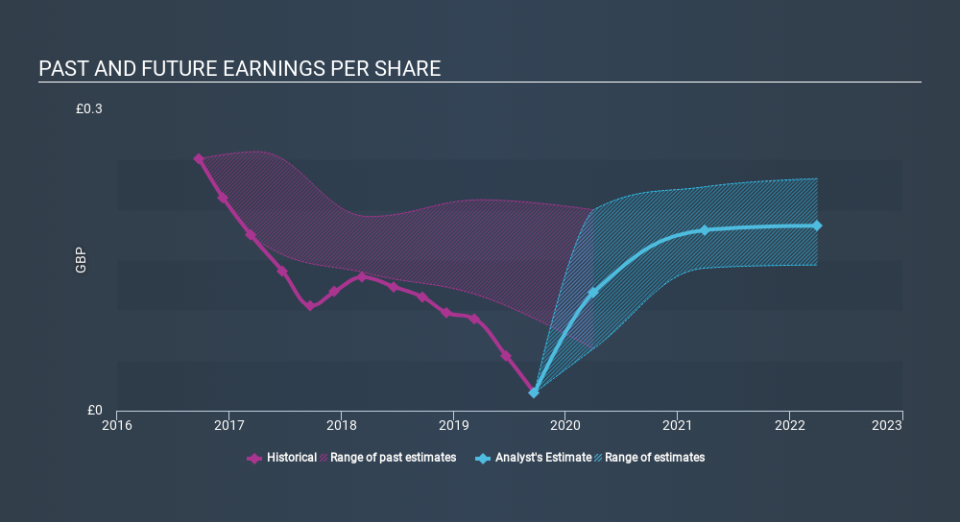
We consider it positive that insiders have made significant purchases in the last year. Even so, future earnings will be far more important to whether current shareholders make money. Before buying or selling a stock, we always recommend a close examination of historic growth trends, available here..
What About Dividends?
As well as measuring the share price return, investors should also consider the total shareholder return (TSR). Whereas the share price return only reflects the change in the share price, the TSR includes the value of dividends (assuming they were reinvested) and the benefit of any discounted capital raising or spin-off. It's fair to say that the TSR gives a more complete picture for stocks that pay a dividend. We note that for J Sainsbury the TSR over the last year was -26%, which is better than the share price return mentioned above. And there's no prize for guessing that the dividend payments largely explain the divergence!
A Different Perspective
While the broader market gained around 12% in the last year, J Sainsbury shareholders lost 26% (even including dividends) . However, keep in mind that even the best stocks will sometimes underperform the market over a twelve month period. Regrettably, last year's performance caps off a bad run, with the shareholders facing a total loss of 1.3% per year over five years. We realise that Buffett has said investors should 'buy when there is blood on the streets', but we caution that investors should first be sure they are buying a high quality business. While it is well worth considering the different impacts that market conditions can have on the share price, there are other factors that are even more important. Case in point: We've spotted 3 warning signs for J Sainsbury you should be aware of.
There are plenty of other companies that have insiders buying up shares. You probably do not want to miss this free list of growing companies that insiders are buying.
Please note, the market returns quoted in this article reflect the market weighted average returns of stocks that currently trade on GB exchanges.
If you spot an error that warrants correction, please contact the editor at editorial-team@simplywallst.com. This article by Simply Wall St is general in nature. It does not constitute a recommendation to buy or sell any stock, and does not take account of your objectives, or your financial situation. Simply Wall St has no position in the stocks mentioned.
We aim to bring you long-term focused research analysis driven by fundamental data. Note that our analysis may not factor in the latest price-sensitive company announcements or qualitative material. Thank you for reading.
