
 Yahoo Finance
 Should Volution Group (LON:FAN) Be Disappointed With Their 18% Profit?

Generally speaking the aim of active stock picking is to find companies that provide returns that are superior to the market average. And in our experience, buying the right stocks can give your wealth a significant boost. For example, the Volution Group plc (LON:FAN) share price is up 18% in the last 5 years, clearly besting than the market return of around 2.5% (ignoring dividends).
See our latest analysis for Volution Group
While the efficient markets hypothesis continues to be taught by some, it has been proven that markets are over-reactive dynamic systems, and investors are not always rational. One flawed but reasonable way to assess how sentiment around a company has changed is to compare the earnings per share (EPS) with the share price.
During the five years of share price growth, Volution Group moved from a loss to profitability. That's generally thought to be a genuine positive, so we would expect to see an increasing share price.
You can see below how EPS has changed over time (discover the exact values by clicking on the image).
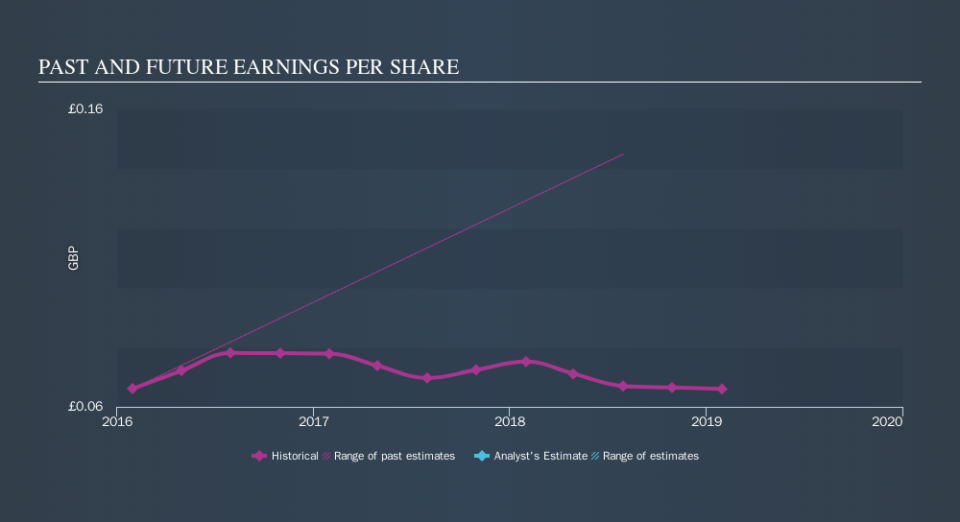
Dive deeper into Volution Group's key metrics by checking this interactive graph of Volution Group's earnings, revenue and cash flow.
What About Dividends?
It is important to consider the total shareholder return, as well as the share price return, for any given stock. The TSR is a return calculation that accounts for the value of cash dividends (assuming that any dividend received was reinvested) and the calculated value of any discounted capital raisings and spin-offs. So for companies that pay a generous dividend, the TSR is often a lot higher than the share price return. We note that for Volution Group the TSR over the last 5 years was 30%, which is better than the share price return mentioned above. This is largely a result of its dividend payments!
A Different Perspective
Investors in Volution Group had a tough year, with a total loss of 6.2% (including dividends), against a market gain of about 5.1%. Even the share prices of good stocks drop sometimes, but we want to see improvements in the fundamental metrics of a business, before getting too interested. Longer term investors wouldn't be so upset, since they would have made 5.4%, each year, over five years. It could be that the recent sell-off is an opportunity, so it may be worth checking the fundamental data for signs of a long term growth trend. Most investors take the time to check the data on insider transactions. You can click here to see if insiders have been buying or selling.
If you would prefer to check out another company -- one with potentially superior financials -- then do not miss this free list of companies that have proven they can grow earnings.
Please note, the market returns quoted in this article reflect the market weighted average returns of stocks that currently trade on GB exchanges.
We aim to bring you long-term focused research analysis driven by fundamental data. Note that our analysis may not factor in the latest price-sensitive company announcements or qualitative material.
If you spot an error that warrants correction, please contact the editor at editorial-team@simplywallst.com. This article by Simply Wall St is general in nature. It does not constitute a recommendation to buy or sell any stock, and does not take account of your objectives, or your financial situation. Simply Wall St has no position in the stocks mentioned. Thank you for reading.
