
 Yahoo Finance
 Is Volution Group plc’s (LON:FAN) 9.4% Return On Capital Employed Good News?

Today we'll look at Volution Group plc (LON:FAN) and reflect on its potential as an investment. To be precise, we'll consider its Return On Capital Employed (ROCE), as that will inform our view of the quality of the business.
First of all, we'll work out how to calculate ROCE. Next, we'll compare it to others in its industry. Then we'll determine how its current liabilities are affecting its ROCE.
Understanding Return On Capital Employed (ROCE)
ROCE is a measure of a company's yearly pre-tax profit (its return), relative to the capital employed in the business. All else being equal, a better business will have a higher ROCE. Ultimately, it is a useful but imperfect metric. Renowned investment researcher Michael Mauboussin has suggested that a high ROCE can indicate that 'one dollar invested in the company generates value of more than one dollar'.
How Do You Calculate Return On Capital Employed?
The formula for calculating the return on capital employed is:
Return on Capital Employed = Earnings Before Interest and Tax (EBIT) ÷ (Total Assets - Current Liabilities)
Or for Volution Group:
0.094 = UK£26m ÷ (UK£328m - UK£48m) (Based on the trailing twelve months to July 2019.)
Therefore, Volution Group has an ROCE of 9.4%.
Check out our latest analysis for Volution Group
Does Volution Group Have A Good ROCE?
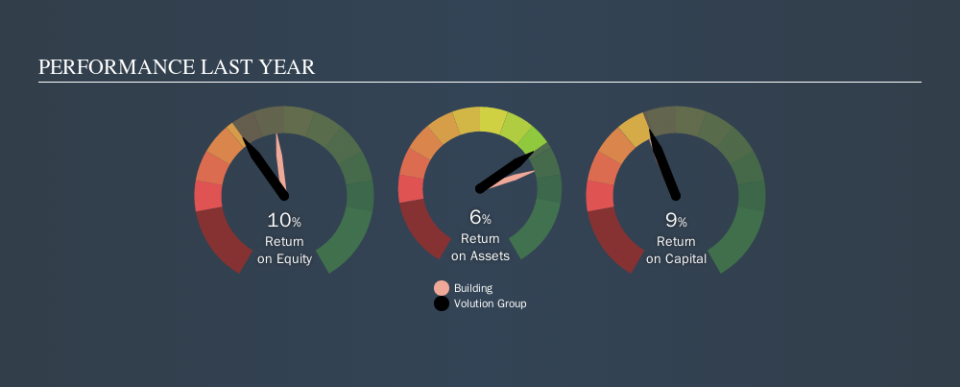
One way to assess ROCE is to compare similar companies. Using our data, Volution Group's ROCE appears to be around the 11% average of the Building industry. Separate from Volution Group's performance relative to its industry, its ROCE in absolute terms looks satisfactory, and it may be worth researching in more depth.
You can see in the image below how Volution Group's ROCE compares to its industry. Click to see more on past growth.
When considering ROCE, bear in mind that it reflects the past and does not necessarily predict the future. Companies in cyclical industries can be difficult to understand using ROCE, as returns typically look high during boom times, and low during busts. This is because ROCE only looks at one year, instead of considering returns across a whole cycle. What happens in the future is pretty important for investors, so we have prepared a free report on analyst forecasts for Volution Group.
How Volution Group's Current Liabilities Impact Its ROCE
Current liabilities include invoices, such as supplier payments, short-term debt, or a tax bill, that need to be paid within 12 months. Due to the way ROCE is calculated, a high level of current liabilities makes a company look as though it has less capital employed, and thus can (sometimes unfairly) boost the ROCE. To counteract this, we check if a company has high current liabilities, relative to its total assets.
Volution Group has total liabilities of UK£48m and total assets of UK£328m. Therefore its current liabilities are equivalent to approximately 15% of its total assets. A fairly low level of current liabilities is not influencing the ROCE too much.
What We Can Learn From Volution Group's ROCE
This is good to see, and with a sound ROCE, Volution Group could be worth a closer look. There might be better investments than Volution Group out there, but you will have to work hard to find them . These promising businesses with rapidly growing earnings might be right up your alley.
If you like to buy stocks alongside management, then you might just love this free list of companies. (Hint: insiders have been buying them).
We aim to bring you long-term focused research analysis driven by fundamental data. Note that our analysis may not factor in the latest price-sensitive company announcements or qualitative material.
If you spot an error that warrants correction, please contact the editor at editorial-team@simplywallst.com. This article by Simply Wall St is general in nature. It does not constitute a recommendation to buy or sell any stock, and does not take account of your objectives, or your financial situation. Simply Wall St has no position in the stocks mentioned. Thank you for reading.
