
 Yahoo Finance
 The Vonovia (ETR:VNA) Share Price Is Up 78% And Shareholders Are Holding On

Generally speaking the aim of active stock picking is to find companies that provide returns that are superior to the market average. And the truth is, you can make significant gains if you buy good quality businesses at the right price. For example, long term Vonovia SE (ETR:VNA) shareholders have enjoyed a 78% share price rise over the last half decade, well in excess of the market return of around 20% (not including dividends). However, more recent returns haven't been as impressive as that, with the stock returning just 15% in the last year , including dividends .
View our latest analysis for Vonovia
To paraphrase Benjamin Graham: Over the short term the market is a voting machine, but over the long term it's a weighing machine. By comparing earnings per share (EPS) and share price changes over time, we can get a feel for how investor attitudes to a company have morphed over time.
Over half a decade, Vonovia managed to grow its earnings per share at 28% a year. This EPS growth is higher than the 12% average annual increase in the share price. So it seems the market isn't so enthusiastic about the stock these days.
You can see below how EPS has changed over time (discover the exact values by clicking on the image).
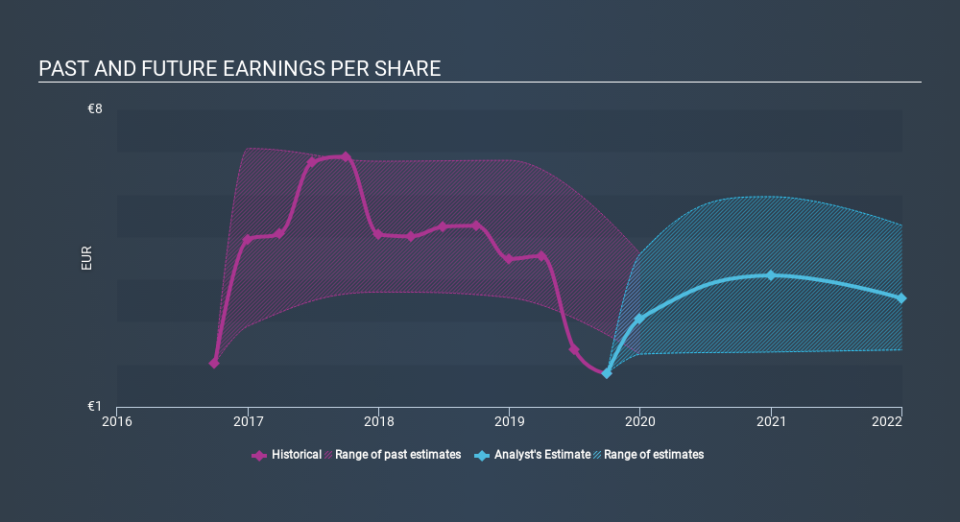
Dive deeper into Vonovia's key metrics by checking this interactive graph of Vonovia's earnings, revenue and cash flow.
What About Dividends?
As well as measuring the share price return, investors should also consider the total shareholder return (TSR). Whereas the share price return only reflects the change in the share price, the TSR includes the value of dividends (assuming they were reinvested) and the benefit of any discounted capital raising or spin-off. So for companies that pay a generous dividend, the TSR is often a lot higher than the share price return. We note that for Vonovia the TSR over the last 5 years was 119%, which is better than the share price return mentioned above. And there's no prize for guessing that the dividend payments largely explain the divergence!
A Different Perspective
Vonovia provided a TSR of 15% over the last twelve months. Unfortunately this falls short of the market return. It's probably a good sign that the company has an even better long term track record, having provided shareholders with an annual TSR of 17% over five years. Maybe the share price is just taking a breather while the business executes on its growth strategy. Importantly, we haven't analysed Vonovia's dividend history. This free visual report on its dividends is a must-read if you're thinking of buying.
If you like to buy stocks alongside management, then you might just love this free list of companies. (Hint: insiders have been buying them).
Please note, the market returns quoted in this article reflect the market weighted average returns of stocks that currently trade on DE exchanges.
If you spot an error that warrants correction, please contact the editor at editorial-team@simplywallst.com. This article by Simply Wall St is general in nature. It does not constitute a recommendation to buy or sell any stock, and does not take account of your objectives, or your financial situation. Simply Wall St has no position in the stocks mentioned.
We aim to bring you long-term focused research analysis driven by fundamental data. Note that our analysis may not factor in the latest price-sensitive company announcements or qualitative material. Thank you for reading.
