
 Yahoo Finance
 Vp (LON:VP.) Hasn't Managed To Accelerate Its Returns
If you're not sure where to start when looking for the next multi-bagger, there are a few key trends you should keep an eye out for. In a perfect world, we'd like to see a company investing more capital into its business and ideally the returns earned from that capital are also increasing. This shows us that it's a compounding machine, able to continually reinvest its earnings back into the business and generate higher returns. However, after briefly looking over the numbers, we don't think Vp (LON:VP.) has the makings of a multi-bagger going forward, but let's have a look at why that may be.
Return On Capital Employed (ROCE): What Is It?
If you haven't worked with ROCE before, it measures the 'return' (pre-tax profit) a company generates from capital employed in its business. To calculate this metric for Vp, this is the formula:
Return on Capital Employed = Earnings Before Interest and Tax (EBIT) ÷ (Total Assets - Current Liabilities)
0.13 = UK£43m ÷ (UK£472m - UK£136m) (Based on the trailing twelve months to September 2023).
Therefore, Vp has an ROCE of 13%. In absolute terms, that's a pretty normal return, and it's somewhat close to the Trade Distributors industry average of 15%.
View our latest analysis for Vp
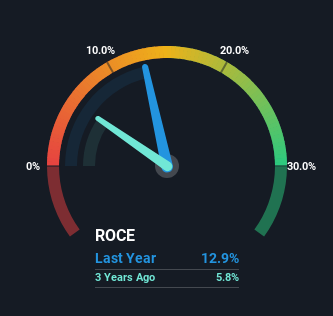
Above you can see how the current ROCE for Vp compares to its prior returns on capital, but there's only so much you can tell from the past. If you'd like, you can check out the forecasts from the analysts covering Vp for free.
What Does the ROCE Trend For Vp Tell Us?
Over the past five years, Vp's ROCE and capital employed have both remained mostly flat. It's not uncommon to see this when looking at a mature and stable business that isn't re-investing its earnings because it has likely passed that phase of the business cycle. With that in mind, unless investment picks up again in the future, we wouldn't expect Vp to be a multi-bagger going forward. This probably explains why Vp is paying out 50% of its income to shareholders in the form of dividends. Given the business isn't reinvesting in itself, it makes sense to distribute a portion of earnings among shareholders.
On another note, while the change in ROCE trend might not scream for attention, it's interesting that the current liabilities have actually gone up over the last five years. This is intriguing because if current liabilities hadn't increased to 29% of total assets, this reported ROCE would probably be less than13% because total capital employed would be higher.The 13% ROCE could be even lower if current liabilities weren't 29% of total assets, because the the formula would show a larger base of total capital employed. With that in mind, just be wary if this ratio increases in the future, because if it gets particularly high, this brings with it some new elements of risk.
What We Can Learn From Vp's ROCE
In summary, Vp isn't compounding its earnings but is generating stable returns on the same amount of capital employed. Since the stock has declined 35% over the last five years, investors may not be too optimistic on this trend improving either. Therefore based on the analysis done in this article, we don't think Vp has the makings of a multi-bagger.
One more thing to note, we've identified 2 warning signs with Vp and understanding them should be part of your investment process.
If you want to search for solid companies with great earnings, check out this free list of companies with good balance sheets and impressive returns on equity.
Have feedback on this article? Concerned about the content? Get in touch with us directly. Alternatively, email editorial-team (at) simplywallst.com.
This article by Simply Wall St is general in nature. We provide commentary based on historical data and analyst forecasts only using an unbiased methodology and our articles are not intended to be financial advice. It does not constitute a recommendation to buy or sell any stock, and does not take account of your objectives, or your financial situation. We aim to bring you long-term focused analysis driven by fundamental data. Note that our analysis may not factor in the latest price-sensitive company announcements or qualitative material. Simply Wall St has no position in any stocks mentioned.
