
 Yahoo Finance
 VTEX Full Year 2023 Earnings: Beats Expectations
VTEX (NYSE:VTEX) Full Year 2023 Results
Key Financial Results
Revenue: US$201.5m (up 28% from FY 2022).
Net loss: US$13.7m (loss narrowed by 74% from FY 2022).
US$0.073 loss per share (improved from US$0.28 loss in FY 2022).
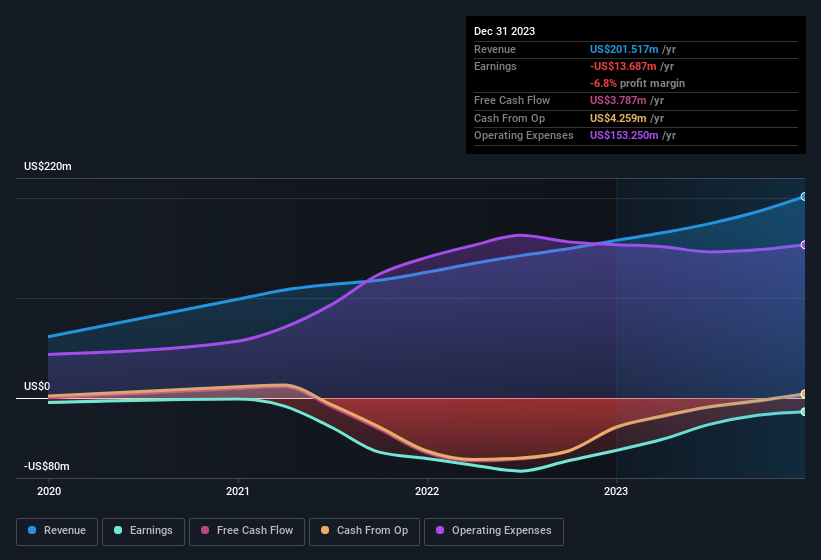
All figures shown in the chart above are for the trailing 12 month (TTM) period
VTEX Revenues and Earnings Beat Expectations
Revenue exceeded analyst estimates by 1.9%. Earnings per share (EPS) also surpassed analyst estimates by 12%.
Looking ahead, revenue is forecast to grow 16% p.a. on average during the next 3 years, compared to a 10.0% growth forecast for the Interactive Media and Services industry in the US.
Performance of the American Interactive Media and Services industry.
The company's shares are up 13% from a week ago.
Balance Sheet Analysis
Just as investors must consider earnings, it is also important to take into account the strength of a company's balance sheet. We have a graphic representation of VTEX's balance sheet and an in-depth analysis of the company's financial position.
Have feedback on this article? Concerned about the content? Get in touch with us directly. Alternatively, email editorial-team (at) simplywallst.com.
This article by Simply Wall St is general in nature. We provide commentary based on historical data and analyst forecasts only using an unbiased methodology and our articles are not intended to be financial advice. It does not constitute a recommendation to buy or sell any stock, and does not take account of your objectives, or your financial situation. We aim to bring you long-term focused analysis driven by fundamental data. Note that our analysis may not factor in the latest price-sensitive company announcements or qualitative material. Simply Wall St has no position in any stocks mentioned.
