
 Yahoo Finance
 Is Wacker Neuson SE’s (FRA:WAC) Balance Sheet A Threat To Its Future?

Investors are always looking for growth in small-cap stocks like Wacker Neuson SE (FRA:WAC), with a market cap of €1.2b. However, an important fact which most ignore is: how financially healthy is the business? Assessing first and foremost the financial health is crucial, since poor capital management may bring about bankruptcies, which occur at a higher rate for small-caps. I believe these basic checks tell most of the story you need to know. Nevertheless, this commentary is still very high-level, so I recommend you dig deeper yourself into WAC here.
Does WAC produce enough cash relative to debt?
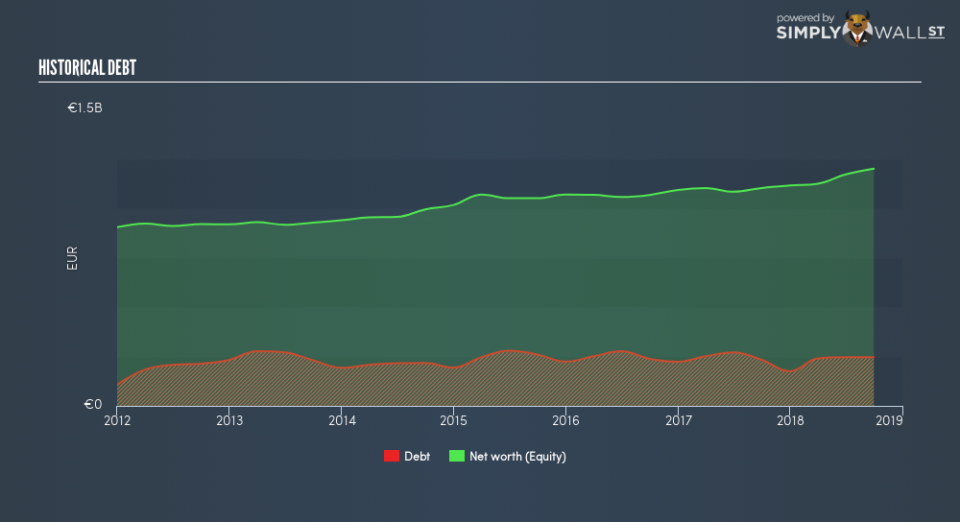
WAC has built up its total debt levels in the last twelve months, from €233m to €247m – this includes long-term debt. With this growth in debt, the current cash and short-term investment levels stands at €61m for investing into the business. Moreover, WAC has produced €37m in operating cash flow in the last twelve months, leading to an operating cash to total debt ratio of 15%, signalling that WAC’s operating cash is not sufficient to cover its debt. This ratio can also be interpreted as a measure of efficiency as an alternative to return on assets. In WAC’s case, it is able to generate 0.15x cash from its debt capital.
Can WAC pay its short-term liabilities?
At the current liabilities level of €336m, it seems that the business has maintained a safe level of current assets to meet its obligations, with the current ratio last standing at 3.09x. However, a ratio greater than 3x may be considered by some to be quite high, however this is not necessarily a negative for the company.
Is WAC’s debt level acceptable?
With a debt-to-equity ratio of 21%, WAC’s debt level may be seen as prudent. WAC is not taking on too much debt commitment, which may be constraining for future growth. We can test if WAC’s debt levels are sustainable by measuring interest payments against earnings of a company. Ideally, earnings before interest and tax (EBIT) should cover net interest by at least three times. For WAC, the ratio of 27.16x suggests that interest is comfortably covered, which means that lenders may be less hesitant to lend out more funding as WAC’s high interest coverage is seen as responsible and safe practice.
Next Steps:
WAC’s high cash coverage and appropriate debt levels indicate its ability to utilise its borrowings efficiently in order to generate ample cash flow. In addition to this, the company exhibits an ability to meet its near term obligations should an adverse event occur. I admit this is a fairly basic analysis for WAC’s financial health. Other important fundamentals need to be considered alongside. I recommend you continue to research Wacker Neuson to get a better picture of the stock by looking at:
Future Outlook: What are well-informed industry analysts predicting for WAC’s future growth? Take a look at our free research report of analyst consensus for WAC’s outlook.
Valuation: What is WAC worth today? Is the stock undervalued, even when its growth outlook is factored into its intrinsic value? The intrinsic value infographic in our free research report helps visualize whether WAC is currently mispriced by the market.
Other High-Performing Stocks: Are there other stocks that provide better prospects with proven track records? Explore our free list of these great stocks here.
To help readers see past the short term volatility of the financial market, we aim to bring you a long-term focused research analysis purely driven by fundamental data. Note that our analysis does not factor in the latest price-sensitive company announcements.
The author is an independent contributor and at the time of publication had no position in the stocks mentioned. For errors that warrant correction please contact the editor at editorial-team@simplywallst.com.
