
 Yahoo Finance
 Want To Invest In Ferrari N.V. (NYSE:RACE)? Here's How It Performed Lately

Measuring Ferrari N.V.'s (NYSE:RACE) track record of past performance is a useful exercise for investors. It enables us to understand whether or not the company has met or exceed expectations, which is an insightful signal for future performance. Today I will assess RACE's recent performance announced on 31 December 2019 and weigh these figures against its long-term trend and industry movements.
See our latest analysis for Ferrari
How Well Did RACE Perform?
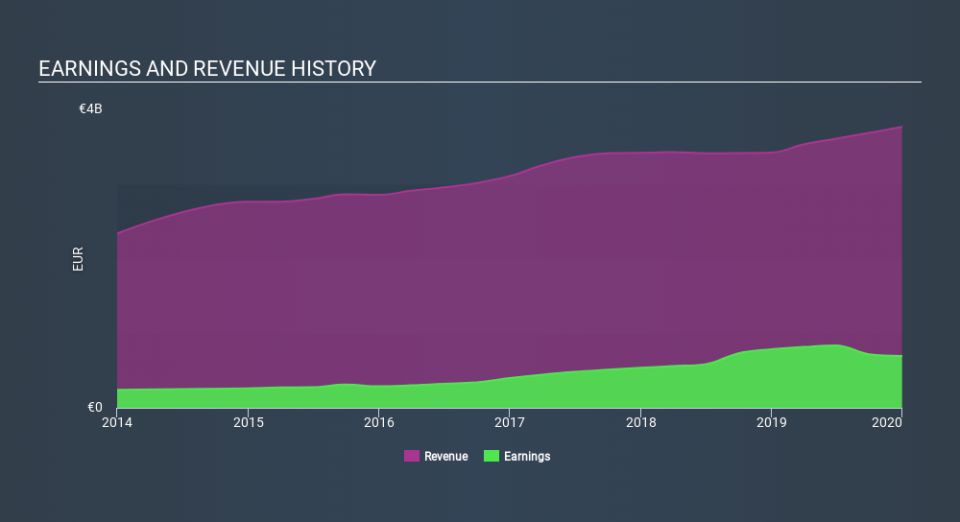
RACE's trailing twelve-month earnings (from 31 December 2019) of €696m has declined by -11% compared to the previous year.
Furthermore, this one-year growth rate has been lower than its average earnings growth rate over the past 5 years of 25%, indicating the rate at which RACE is growing has slowed down. Why is this? Let's examine what's going on with margins and whether the rest of the industry is feeling the heat.
In terms of returns from investment, Ferrari has invested its equity funds well leading to a 47% return on equity (ROE), above the sensible minimum of 20%. Furthermore, its return on assets (ROA) of 13% exceeds the US Auto industry of 4.6%, indicating Ferrari has used its assets more efficiently. However, its return on capital (ROC), which also accounts for Ferrari’s debt level, has declined over the past 3 years from 26% to 23%. This correlates with an increase in debt holding, with debt-to-equity ratio rising from 21% to 136% over the past 5 years.
What does this mean?
Though Ferrari's past data is helpful, it is only one aspect of my investment thesis. Companies that are profitable, but have capricious earnings, can have many factors influencing its business. You should continue to research Ferrari to get a more holistic view of the stock by looking at:
Future Outlook: What are well-informed industry analysts predicting for RACE’s future growth? Take a look at our free research report of analyst consensus for RACE’s outlook.
Financial Health: Are RACE’s operations financially sustainable? Balance sheets can be hard to analyze, which is why we’ve done it for you. Check out our financial health checks here.
Other High-Performing Stocks: Are there other stocks that provide better prospects with proven track records? Explore our free list of these great stocks here.
NB: Figures in this article are calculated using data from the trailing twelve months from 31 December 2019. This may not be consistent with full year annual report figures.
If you spot an error that warrants correction, please contact the editor at editorial-team@simplywallst.com. This article by Simply Wall St is general in nature. It does not constitute a recommendation to buy or sell any stock, and does not take account of your objectives, or your financial situation. Simply Wall St has no position in the stocks mentioned.
We aim to bring you long-term focused research analysis driven by fundamental data. Note that our analysis may not factor in the latest price-sensitive company announcements or qualitative material. Thank you for reading.
