
 Yahoo Finance
 Warren Buffett Indicator Exceeds 135%
- By James Li
Warren Buffett (Trades, Portfolio)'s market indicator reached a new milestone July 21, breaking the 10-year high set around June 29. The Shiller PE, an alternative market valuation ratio, is over 80% higher than the historical mean. Based on the current valuations, the U.S. stock market is expected to return less than -1.3% per year over the next several years.
Warning! GuruFocus has detected 5 Warning Signs with COF. Click here to check it out.
The intrinsic value of BRK.A
Buffett indicator reaches new milestone
According to Buffett, the percent of total market cap relative to the U.S. gross domestic product is "probably the best single measure of where valuations stand at any given moment." The total market index stands at $25683.1 billion, approximately 135% of the last reported U.S. GDP.

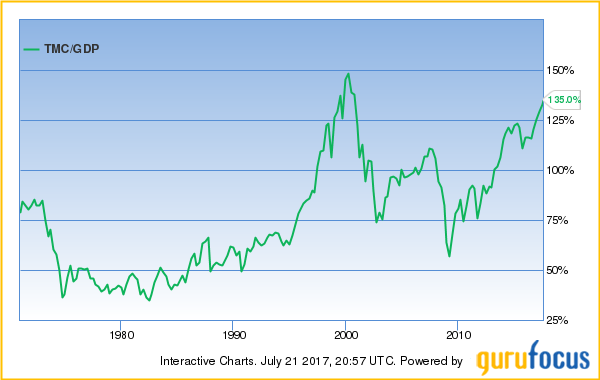
As illustrated in Figure 1, the market price-sales ratio climbed approximately 20% since its July 2016 value of 119.40%. Although the Buffett indicator slightly declined in late 2016, the market indicator reached 130% by February 2017 and remained above 130% since April 2017.

Figure 1
Shiller PE "severely" above historical mean
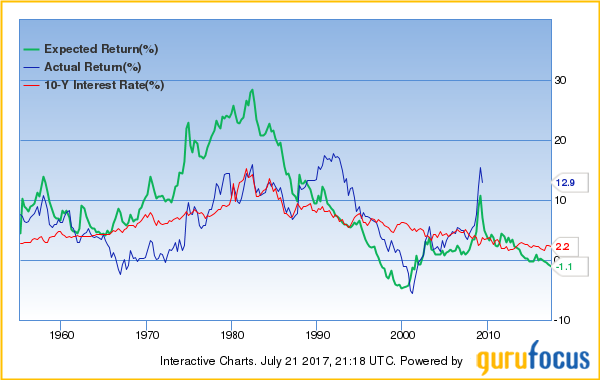
Robert Shiller's cyclically-adjusted price-earnings (CAPE) ratio increased to 30.60, approximately 82.1% higher than the historical mean of 16.8. The Shiller PE would be twice the historical mean if it increases another 3%.

The U.S. stock market is expected to return -2.2% per year if the Shiller PE reverts exactly to the mean in eight years. In reality, the Shiller PE seldom reverts 100% to the mean. The expected annual return can be as low as -9.9% if the Shiller PE reverts to just 50% of the mean. Even if the Shiller PE reverts to 150% of the mean, the expected annual return is just 2.7%.
Is there still hope for investors?
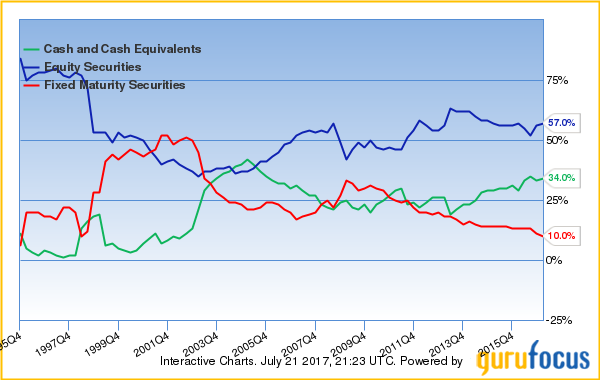
The Berkshire Hathaway Inc. (BRK-A)(BRK-B) managers increased their cash holdings and decreased their equity holdings during the recent quarters. Despite this, three model portfolios still outperform the S&P 500 benchmark in at least seven of the past nine years: the Most Broadly Held portfolio, the Buffett-Munger portfolio and the Undervalued Predictable portfolio. The Undervalued Predictable portfolio gained 220.24% since its inception, outperforming the benchmark by approximately 50% over the period. Buffett's investing strategy led to a 175.88% return since GuruFocus implemented the Buffett-Munger portfolio on Dec. 31, 2008.


A previous article discussed winning strategies for the rest of year using the All-in-one Screener's backtesting feature. Premium members have full access to all value screeners, including three years of historical backtesting data. Premium Plus members can view and screen using data up to January 2006, the first year we have backtesting data available.
Disclosure: The author has no positions in the stocks mentioned.
This article first appeared on GuruFocus.
Warning! GuruFocus has detected 5 Warning Signs with COF. Click here to check it out.
The intrinsic value of BRK.A
