
 Yahoo Finance
 Be Wary Of Infas Holding (FRA:IFS) And Its Returns On Capital
Finding a business that has the potential to grow substantially is not easy, but it is possible if we look at a few key financial metrics. Typically, we'll want to notice a trend of growing return on capital employed (ROCE) and alongside that, an expanding base of capital employed. Ultimately, this demonstrates that it's a business that is reinvesting profits at increasing rates of return. In light of that, when we looked at Infas Holding (FRA:IFS) and its ROCE trend, we weren't exactly thrilled.
Return On Capital Employed (ROCE): What Is It?
For those who don't know, ROCE is a measure of a company's yearly pre-tax profit (its return), relative to the capital employed in the business. Analysts use this formula to calculate it for Infas Holding:
Return on Capital Employed = Earnings Before Interest and Tax (EBIT) ÷ (Total Assets - Current Liabilities)
0.065 = €2.3m ÷ (€54m - €19m) (Based on the trailing twelve months to June 2023).
So, Infas Holding has an ROCE of 6.5%. In absolute terms, that's a low return but it's around the Media industry average of 7.6%.
Check out our latest analysis for Infas Holding
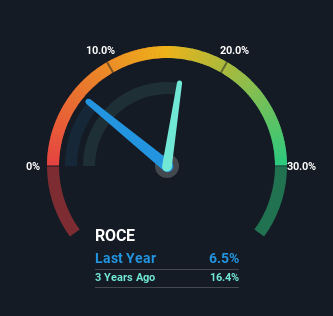
Historical performance is a great place to start when researching a stock so above you can see the gauge for Infas Holding's ROCE against it's prior returns. If you'd like to look at how Infas Holding has performed in the past in other metrics, you can view this free graph of Infas Holding's past earnings, revenue and cash flow.
What The Trend Of ROCE Can Tell Us
On the surface, the trend of ROCE at Infas Holding doesn't inspire confidence. Over the last five years, returns on capital have decreased to 6.5% from 27% five years ago. Although, given both revenue and the amount of assets employed in the business have increased, it could suggest the company is investing in growth, and the extra capital has led to a short-term reduction in ROCE. And if the increased capital generates additional returns, the business, and thus shareholders, will benefit in the long run.
The Bottom Line On Infas Holding's ROCE
In summary, despite lower returns in the short term, we're encouraged to see that Infas Holding is reinvesting for growth and has higher sales as a result. These growth trends haven't led to growth returns though, since the stock has fallen 17% over the last five years. As a result, we'd recommend researching this stock further to uncover what other fundamentals of the business can show us.
If you want to know some of the risks facing Infas Holding we've found 2 warning signs (1 is potentially serious!) that you should be aware of before investing here.
While Infas Holding isn't earning the highest return, check out this free list of companies that are earning high returns on equity with solid balance sheets.
Have feedback on this article? Concerned about the content? Get in touch with us directly. Alternatively, email editorial-team (at) simplywallst.com.
This article by Simply Wall St is general in nature. We provide commentary based on historical data and analyst forecasts only using an unbiased methodology and our articles are not intended to be financial advice. It does not constitute a recommendation to buy or sell any stock, and does not take account of your objectives, or your financial situation. We aim to bring you long-term focused analysis driven by fundamental data. Note that our analysis may not factor in the latest price-sensitive company announcements or qualitative material. Simply Wall St has no position in any stocks mentioned.
